Ethereum Holds the $2,000 Line Today, but Is a Breakout Next or More Sideways Ahead?
Jakarta, Pintu News – Ethereum (ETH) price briefly breached $2,000 this week, but struggled to sustain higher levels. Trading data shows volatility in the crypto and stock markets limited the gains.
Market participants are now watching whether a daily close above $2,100 can stabilize order flow and prevent the next sharp decline.
In a broader context, Ethereum’s price movements are influenced by changes in positions in the derivatives market as well as the profit levels of large holders. Since early 2024, macro-driven fluctuations in risk assets have shaped the momentum of digital assets. This puts the Ethereum price at a crucial technical juncture, where the whale cost base, funding dynamics, and liquidation map converge.
Ethereum Price Drops 0.26% in 24 Hours
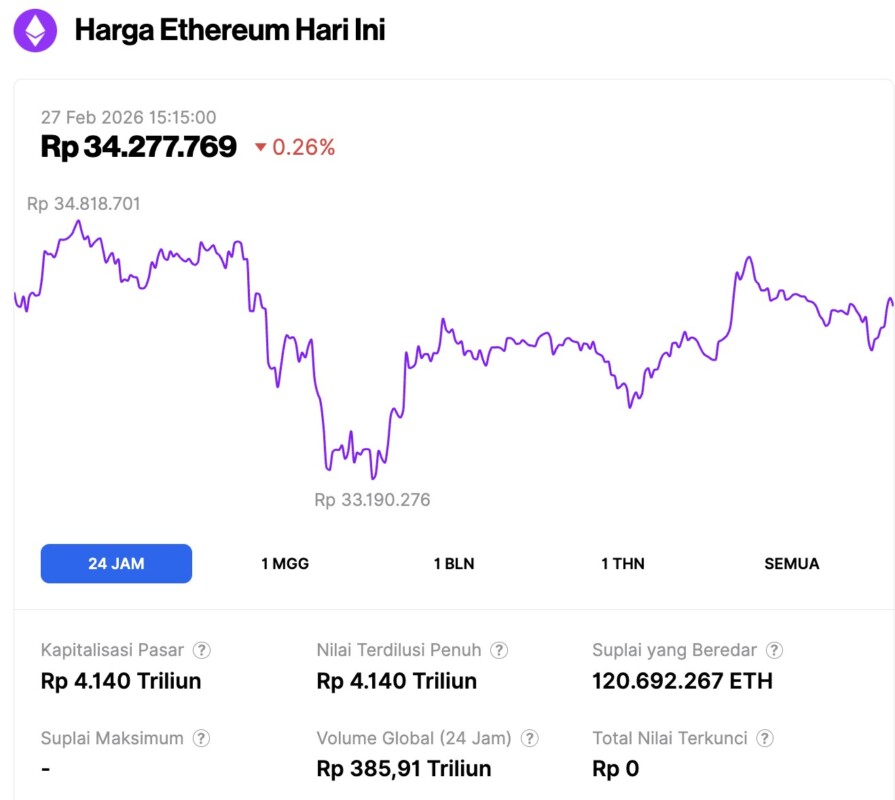
On February 27, 2026, Ethereum was trading at about $2,036 (approximately IDR 34,277,769), down 0.26% over the past 24 hours. Within that window, ETH moved between a low of IDR 33,190,276 and a high of IDR 34,818,701.
At the time of writing, Ethereum’s market capitalization is roughly IDR 4,140 trillion. Meanwhile, 24-hour trading volume declined 28% to around IDR 385.91 trillion.
Read also: Bitcoin Price Returns to $67,000 Today: BTC ETF Inflows Reach $506 Million!
Whale Cost Basis Determines Nearest Resistance
CryptoQuant data shows that wallets with a minimum holding of 100,000 ETH have a realized price around $2,100, in line with the most recent price rejection area. The realized price reflects the last transaction price of the coin that changed hands, so it serves as a profitability benchmark, not a spot price reference.
Since 2020, the Ethereum price has relatively rarely moved below the cost base of this group, except in the bear market phase of 2022.
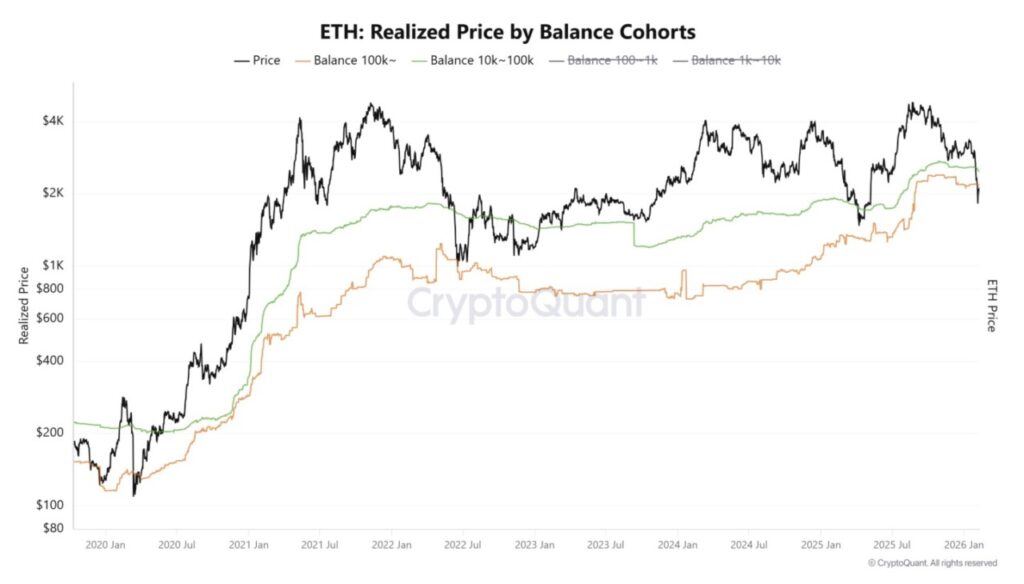
Such historical patterns are important because the success of holding above a large holder’s cost base often influences market sentiment. When whales are in profit, defensive selling pressure tends to decrease. Conversely, failure to maintain that level keeps market positioning cautious and reinforces the sideways character of the movement within a certain range.
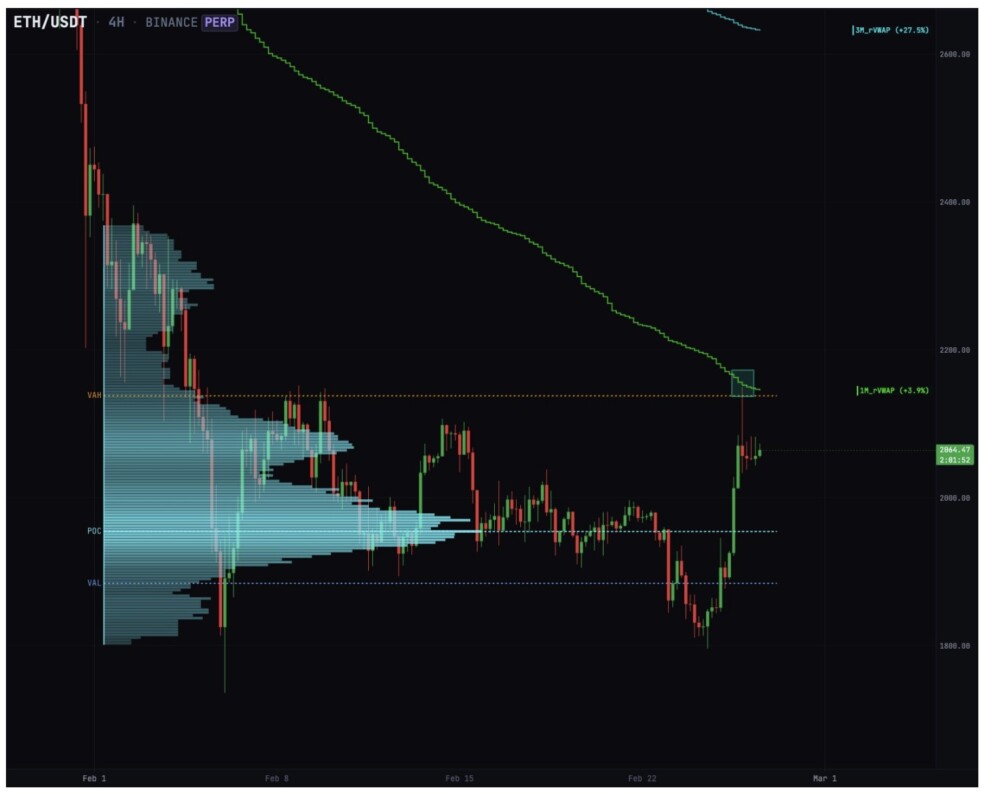
Order flow metrics also confirmed the tension. Futures analyst Dom noted that prices swept the lows earlier in the week, then touched the one-month rolling volume-weighted average price (VWAP) as well as the upper limit of the value area. These moves were more indicative of responsive buying at the extremes of the range, rather than an aggressive continuation of the trend.
Acceptance above $2,140 would signal the emergence of new demand, while rejection in that area keeps the balance in the already formed movement structure.
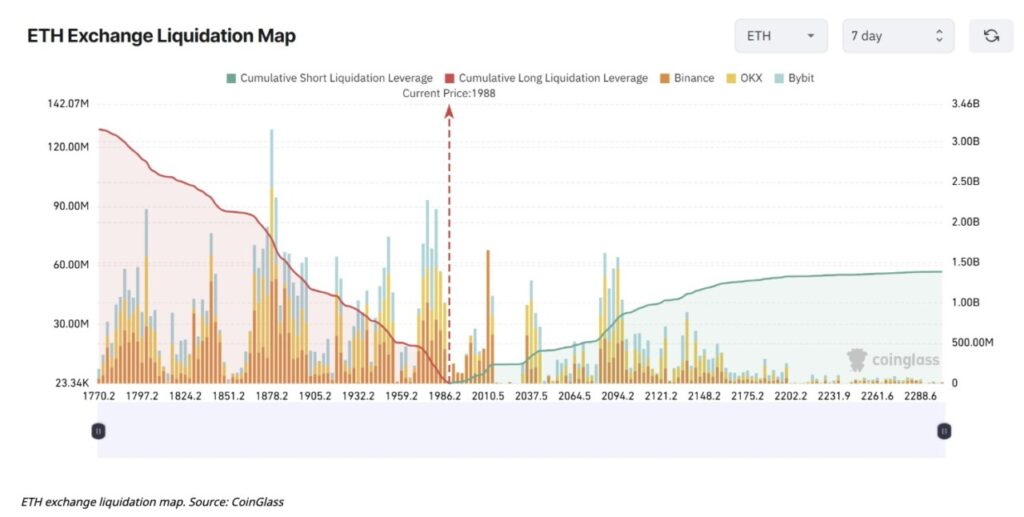
Funding Change Indicates Overcrowded Long Positions
CoinGlass data shows a liquidation of short positions that surpassed $220 million during the latest rally, essentially wiping out leverage-based bear bets. The squeeze coincided with the rapid recovery of funding rates on a number of major exchanges.
Binance’s derivatives metrics show funding reversing to 0.23% after having moved sharply into negative territory earlier this month.
This change occurred because traders who added short positions when the price was below $1,800 were forced to close their positions when the price bounced. Once funding becomes positive, the market’s positioning bias tilts to the long side. High funding often reflects optimism, but it also increases vulnerability if momentum weakens or price movement stalls.
Read also: AI and Recession Quietly Ready to Trigger 2026’s Biggest Crypto Bull Run?
The CoinGlass heatmap also shows around $2.66 billion of cumulative long liquidation exposure concentrated in the $1,800 area. This zone is below the current price range, making it a potential “magnet” should prices weaken. When leverage builds up unevenly, the market often tests areas of forced exit concentration.
Ethereum Price Technical Structure Limits Upside Efforts
Chart analysis from IncomeSharks identified repeated rejection of the SuperTrend indicator on the daily timeframe. The SuperTrend uses the average true range to read trend bias, and turns red when sellers dominate.
Any bounce back is held near the dynamic resistance, which indicates the supply in the upper area is still strong.
The resistance channel around $2,250 adds another technical limit to the upside potential. As long as the price has not decisively breached this level, the rally is likely to be corrective within a broader range. This structure implies that the bullish side needs sustained momentum, not just a short intraday push.
On the downside, analysts highlight the April low area around $1,500 as a reference zone. This level coincides with the weekly demand band in the range of $1,691 to $1,384. Buyers previously entered the region, so the area could act as a re-accumulation zone if volatility picks up again.
Derivative Position Context and Order Flow
The context of derivatives positioning and order flow suggests that flows in the derivatives market determine the short-term direction of the Ethereum price more than accumulation in the spot market. Funding shifts, liquidation sweeps, and volume-based benchmarks indicate market participants are responding tactically, rather than strategically building positions.
Short squeezes are capable of creating temporary gains, but their continuation remains dependent on consistent spot demand.
Whale profitability also adds a psychological dimension. When large holders are around breakeven, they tend to defend levels that protect their cost base. This defensive stance may form support, but it does not automatically ensure the continuation of the breakout.
Without an increase in volume and an influx of new capital, prices generally move up and down around the equilibrium point.
Macro conditions also affected participation. Higher volatility in the stock market lowers confidence in risky assets and suppresses upside efforts. As correlations strengthen amid uncertainty, crypto markets tend to follow the hesitation seen in traditional markets.
Currently, Ethereum’s price action depends on buyers’ ability to secure a solid daily close above the realized whale level. Failing that, the liquidity pocket at $1,800 remains vulnerable to a potential sweep.
On the contrary, price acceptance above $2,250 will change the short-term structure and open up space towards $2,500, while rejection in the area maintains the range-bound condition and keeps the movement reactive to the leverage imbalance.
Follow us on Google News to stay up to date with the latest in crypto and blockchain technology. Check Bitcoin price, usdt to idr and tokenized nvidia stock price via Pintu Market.
Enjoy an easy and secure crypto trading and crypto gold investment experience by downloading the Pintu crypto app via Play Store or App Store now. Also, experience web trading with advanced trading tools such as pro charting, various order types, and portfolio tracker only at Pintu Pro.
*Disclaimer
This content aims to enrich readers’ information. Pintu collects this information from various relevant sources and is not influenced by outside parties. Note that an asset’s past performance does not determine its projected future performance. Crypto trading activities are subject to high risk and volatility, always do your own research and use cold hard cash before investing. All activities of buying and selling Bitcoin and other crypto asset investments are the responsibility of the reader.
Reference:
- Coin Republic. Ethereum Price Faces Make-or-Break Moment Above $2.1K. Accessed on February 27, 2026
Latest News
© 2026 PT Pintu Kemana Saja. All Rights Reserved.
The trading of crypto assets is carried out by PT Pintu Kemana Saja, a licensed and regulated Digital Financial Asset Trader supervised by the Financial Services Authority (OJK), and a member of PT Central Finansial X (CFX) and PT Kliring Komoditi Indonesia (KKI). Crypto asset trading is a high-risk activity. PT Pintu Kemana Saja do not provide any investment and/or crypto asset product recommendations. Users are responsible for thoroughly understanding all aspects related to crypto asset trading (including associated risks) and the use of the application. All decisions related to crypto asset and/or crypto asset futures contract trading are made independently by the user.