Solana Price Prediction March 2026: Will SOL Price Fall to $59?
Jakarta, Pintu News – Solana (SOL) entered March under strong pressure. SOL fell more than 31% on a monthly basis, with February alone recording a 17% decline. However, Solana’s price weakness is only part of the problem. Behind the chart movements, the economic engine that drives Solana until the end of 2025 – itsecoin ecosystem – has been damaged.
On-chain data tracking holders, fund flows to/from exchanges, and DEX activity also corroborate the same conclusion: the selling pressure is structural, not just seasonal.
The question for March is no longer whether Solana can bounce. The question is whether there is anything capable of stopping a pattern that is already in motion and preventing it from reaching its final target.
Bearish Pattern Meets Broken Machine
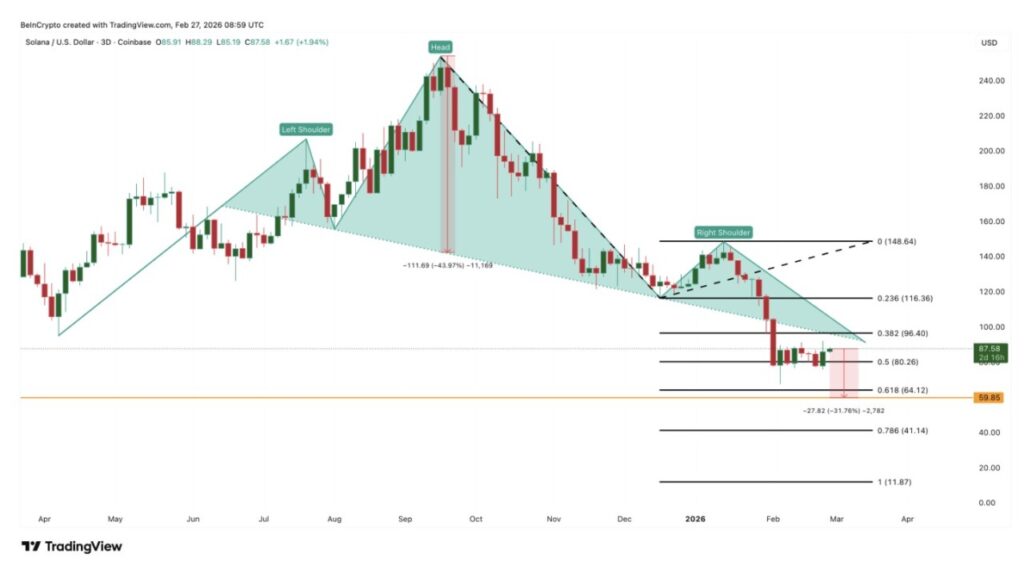
The 3-day chart shows a confirmed head-and-shoulders pattern, with the neckline area around $107 broken around January 31. The measured move projection of the breakout-around 44% of the neckline-places the technical target at around $59.
Read also: Signs of an Altcoin Breakout are Building for March, Despite a Slow Market
At the end of February, SOL was trading around $87, which means that the pattern was only partially fulfilled. From this level, there remains an additional downside potential of around 30% if the movement follows the target to completion.
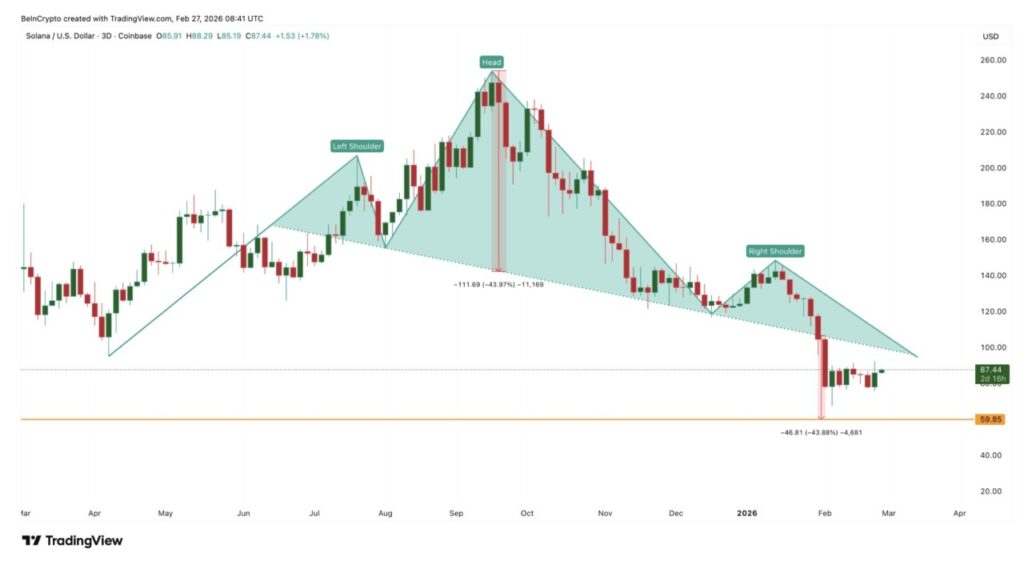
What makes this configuration look even more solid is that the timing of the neckline break coincides with the collapse of the ecosystem that has been driving Solana’s on-chain economy, namely the meme coin sector.
In the week ending February 2, Solana’s total DEX volume was $118.2 billion, with Pump.fun contributing $61.4 billion and Meteora contributing $20.1 billion. But in the week ending February 23, the total volume plummeted to $44.5 billion – a 62% drop – according to exclusive Dune data quoted by analysts on the BeInCrypto page.
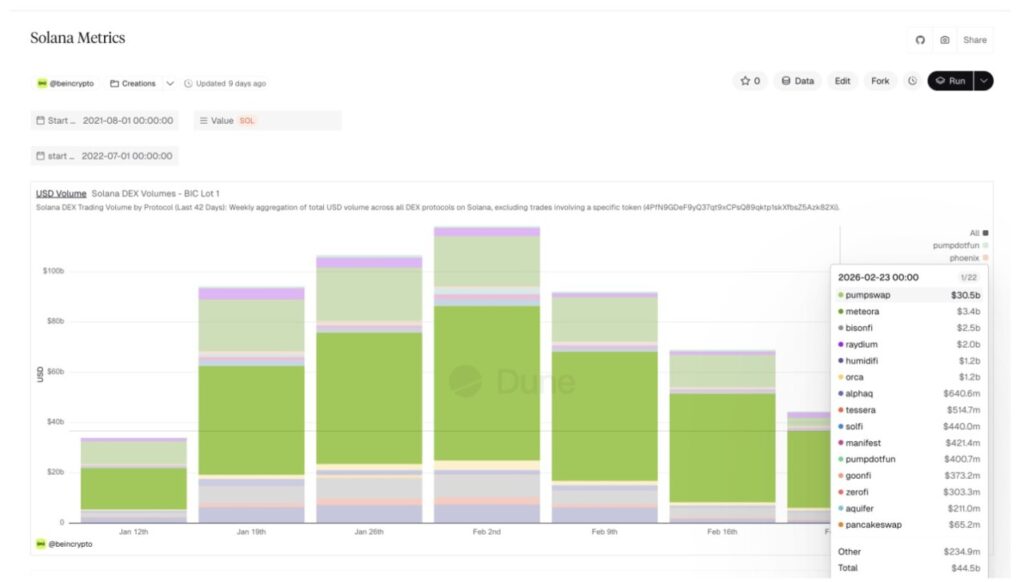
In the same period, Pump.fun’s volume fell to $30.5 billion, while Meteora slumped 83% to just $3.4 billion.
The technical downturn on the charts and the collapse of memecoin activity are not two standalone events. The pattern began to form when market confidence had already cracked. And without his main revenue driver, Solana now faces the rest of the measured move with a weakened fundamental foundation underneath.
Seasonal History and SOL Data Holders Provide No Relief
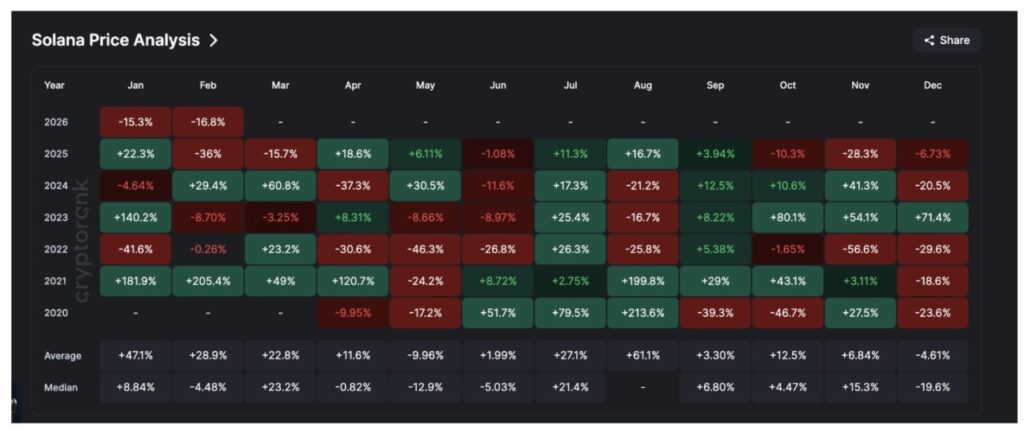
In previous cycles, seasonal data usually gives little hope. March had a median increase of 22.8% for Solana, while February’s historical average hovers around +28.9%. However, February 2026 actually recorded -17%, and January posted a 15% decline – contrary to its historical average of around +47%.
Two consecutive red months are enough to break the seasonal “mold”. The “red month, green month” narrative is no longer relevant when the same pattern fails twice in a row-especially when the drivers of the losses are structural, not cyclical.
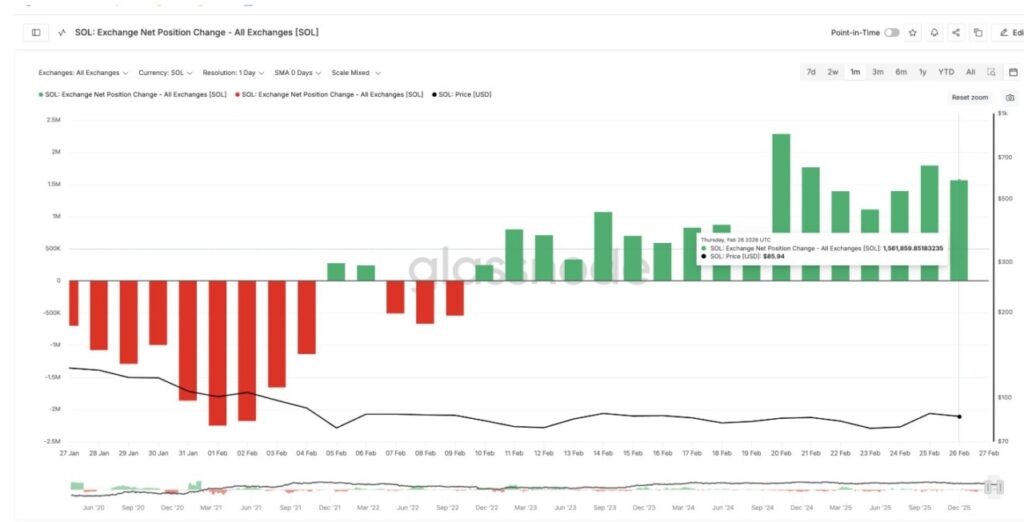
Data holders corroborate this conclusion. In early February, when DEX volumes were peaking at $118.2 billion, the Exchange Net Position Change metric that records netflows was in deep negative territory-tokens were flowing out of the exchange, a classic accumulation signal. This behavior was in line with the on-chain optimism of the period.
But on February 26, the situation completely reversed. Net inflows to the exchange surged to 1,561,859 SOL on a 30-day rolling basis-up about 40% from the 1,106,796 level recorded just three days earlier, on February 23. As the memecoin economy collapsed and DEX volumes went into freefall, holders likely responded by moving tokens to exchanges for liquidation.
Read also: 3 Crypto that Stand Out and Shine Amidst the Bearish Market
On the other hand, longer-term holdings tell a similar story. The Hodler Net Position Change metric-an indicator of accumulation by longer-term wallets-peaked in late January (near the moment of the pattern breakdown) at around 3.47 million SOL on a rolling 30-day basis. By February 26, it had collapsed to just 266,744 SOL – a 92% drop and a monthly low.
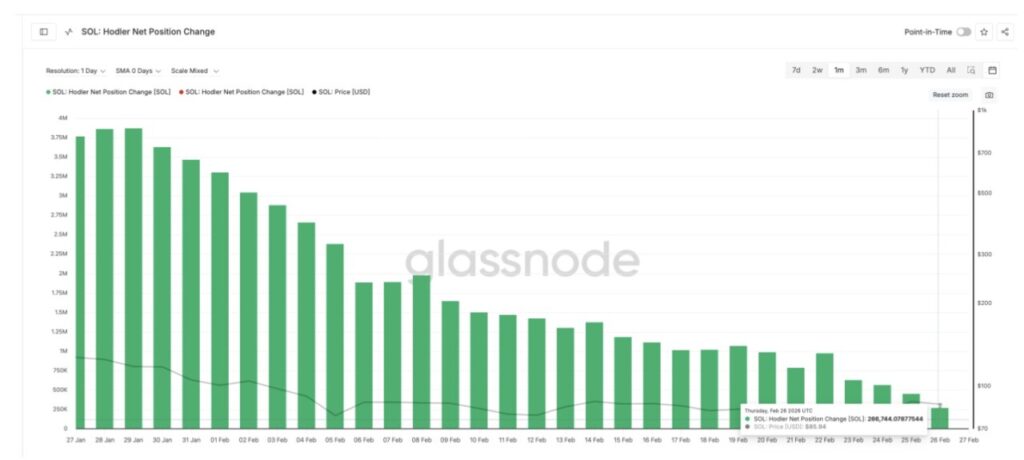
This means that buyers, who usually support the recovery, are retreating, not entering.
ETF flows are the only support
Amidst the series of negative signals, there was one piece of data that moved in the opposite direction. The Solana spot ETF continued to record positive weekly inflows throughout February, even as Bitcoin and Ethereum ETFs collectively experienced outflows.
In the week ending February 20, the SOL ETF absorbed $14.31 million. In the week ending February 26, the figure almost tripled to $43.13 million-the highest in the month.
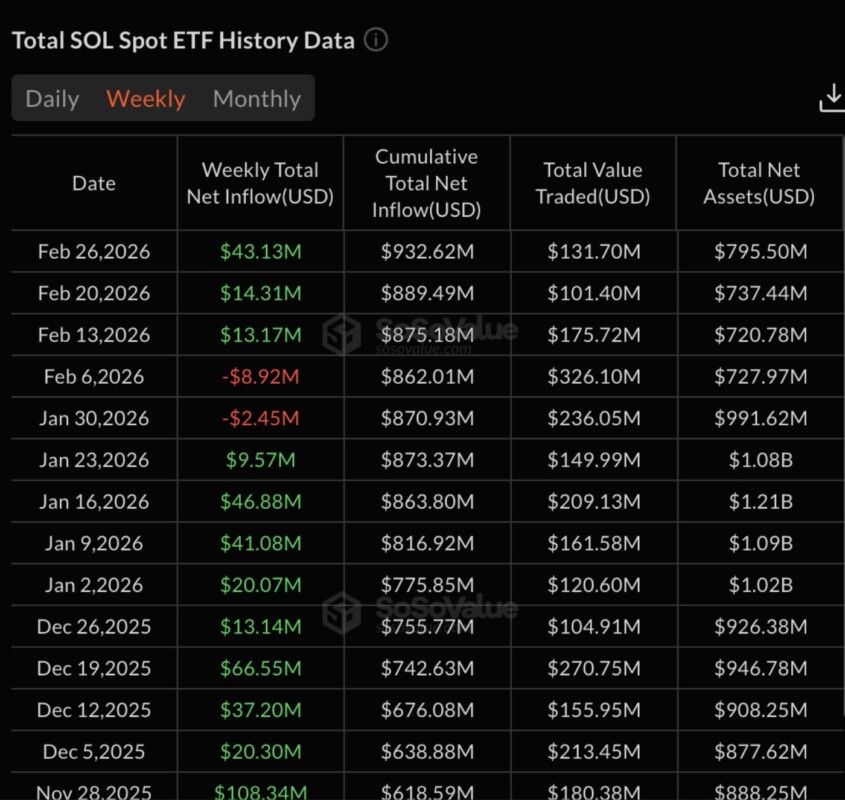
Cumulatively, the SOL ETF’s total inflows have now surpassed $900 million since launch, with more than 12 consecutive days of net inflows recorded during February.
The demand for ETFs is real. This indicates that a bottom is likely to form at some point, and an occasional bounce is to be anticipated. However, this support has not been sufficient. SOL remained down 17% in February despite institutional buying taking place almost without a break.
The scale of on-chain selling pressure-including from the more sentiment-sensitive side-is still greater than ETF demand.
Solana Key Price Levels for March
The $80 zone absorbed the most price action during this weakening phase-there were repeated tests, making it the most important short-term support. However, too frequent tests tend to weaken the level, not strengthen it. A decisive break below $80 opens up room for continuation towards $64, then a head-and-shoulders target around $59.
On the upside, strength cannot be judged recovered until SOL reclaims $96, followed by $116-the January “fail-safe” level that now serves as the gateway to structural recovery. If $59 is broken, the next important level on the 3-day chart is around $41.
One catalyst could potentially interrupt the bearish trajectory. The Alpenglow upgrade-the most ambitious Solana consensus upgrade with a finality target of under one second-targets mainnet deployment in the first quarter of 2026.
If new details emerge in March, the narrative could potentially shift from “chain memecoins” to institutionalized infrastructure.
Probabilistically, March is likely to be determined by whether $80 holds. Above it, the main expectation is an untidy consolidation with a bounce triggered by ETF flows. Below that, a measured move towards the $59-64 area becomes the base scenario.
As long as the holder’s behavior hasn’t reversed, DEX activity hasn’t stabilized, and Alpenglow hasn’t provided execution certainty, the direction with the lowest resistance remains downwards.
Follow us on Google News to stay up to date with the latest in crypto and blockchain technology. Check Bitcoin price, usdt to idr and tokenized nvidia stock price through Pintu Market.
Enjoy an easy and secure crypto trading and crypto gold investment experience by downloading the Pintu crypto app via Play Store or App Store now. Also, experience web trading with advanced trading tools such as pro charting, various order types, and portfolio tracker only at Pintu Pro.
*Disclaimer
This content aims to enrich readers’ information. Pintu collects this information from various relevant sources and is not influenced by outside parties. Note that an asset’s past performance does not determine its projected future performance. Crypto trading activities are subject to high risk and volatility, always do your own research and use cold hard cash before investing. All activities of buying and selling Bitcoin and other crypto asset investments are the responsibility of the reader.
Reference:
- BeInCrypto. Solana (SOL) Price Prediction March 2026. Accessed on March 2, 2026
Latest News
© 2026 PT Pintu Kemana Saja. All Rights Reserved.
The trading of crypto assets is carried out by PT Pintu Kemana Saja, a licensed and regulated Digital Financial Asset Trader supervised by the Financial Services Authority (OJK), and a member of PT Central Finansial X (CFX) and PT Kliring Komoditi Indonesia (KKI). Crypto asset trading is a high-risk activity. PT Pintu Kemana Saja do not provide any investment and/or crypto asset product recommendations. Users are responsible for thoroughly understanding all aspects related to crypto asset trading (including associated risks) and the use of the application. All decisions related to crypto asset and/or crypto asset futures contract trading are made independently by the user.