XRP Ready to Rise? Ripple (XRP) Price Analysis in March 2026!
Jakarta, Pintu News – The price of XRP (XRP) has been under pressure since early 2026, continuing a consistent downtrend since early January. The altcoin has repeatedly failed to break back through a number of key resistance levels.
Weak macro sentiment and rising geopolitical tensions are limiting the upward momentum in the overall crypto market. Although the decline is still ongoing, some historical indicators and on-chain metrics indicate XRP may be approaching a turning point in price movement.
XRP Holder Losses Near End of Worst Phase
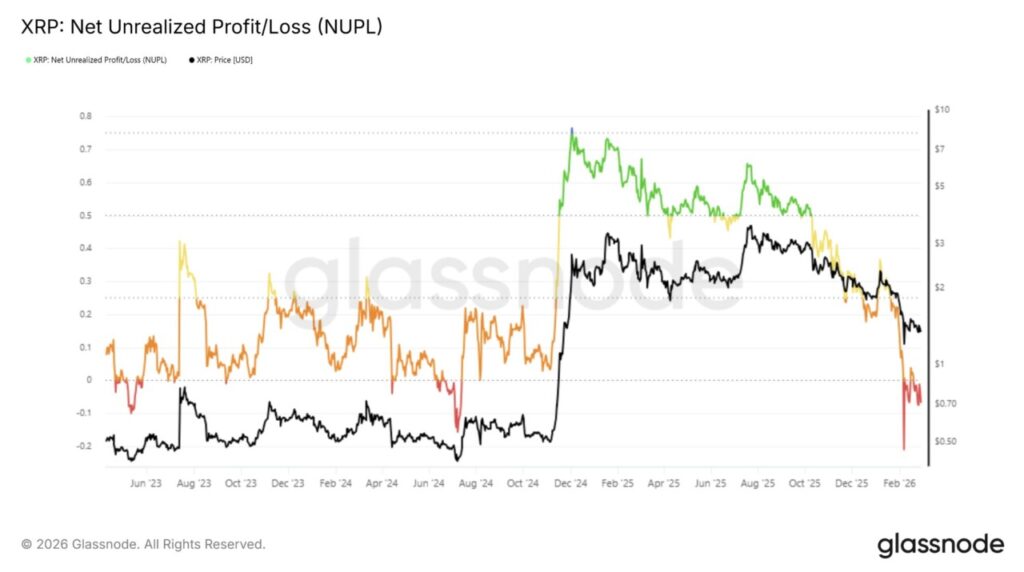
The Net Unrealized Profit and Loss (NUPL) indicator shows XRP is still in its capitulation territory. This phase signifies that the majority of holders are still carrying unrealized losses. Capitulation generally reflects the final stage of a downtrend, not the beginning of a downward movement.
Read also: Solana Price Prediction March 2026: Will SOL Price Fall to $59?
Historically, XRP capitulation phases tend to last about a month before reversing course. The current period started in early February. If the previous pattern is repeated, this phase could potentially end in the first week of March. As the panic-induced sell-off subsides, prices are likely to stabilize and open up room for recovery.
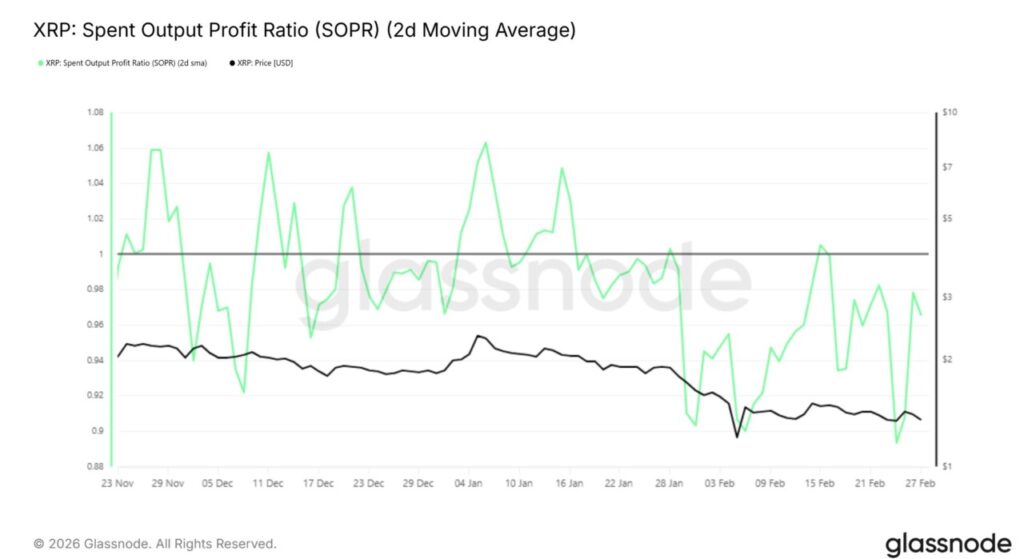
The Spent Output Profit Ratio (SOPR) confirms that many XRP holders are still offloading their assets at a loss. The SOPR briefly moved above the 1 level in mid-February, which signaled temporary profitability. However, the metric soon fell back below 1, signaling that selling pressure was building again.
The position of SOPR, which is again close to level 1, is an important point. If SOPR is able to stay above this threshold, it means that the coin is starting to be sold at a profit. Historically, this change often aligns with the initial phase of recovery. If the selling pressure begins to saturate, the XRP price has the potential to get room to bounce.
What to Read from XRP History?
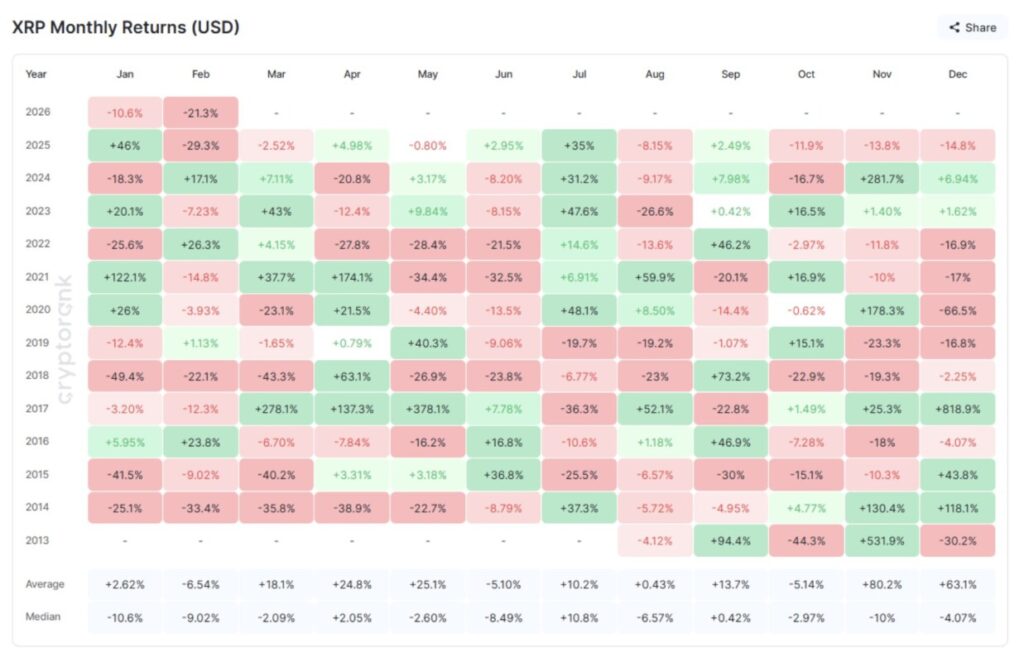
Seasonal data shows that in the last 12 years, March provided an average return of around 18% for XRP, making it statistically the strongest month of the first quarter.
While past performance does not guarantee future gains, historical patterns remain relevant as context. However, external risks are still substantial. Rising geopolitical tensions involving the $US and Israel could suppress risk appetite. In addition, broader financial market instability could potentially delay seasonal bullish tendencies.
Read also: Altcoins Ready to Explode in March? Strong Signals Are Starting to Emerge Amidst a Lethargic Market!
XRP Price Levels to Watch
On February 28, XRP was trading at $1.29 and is still holding above the crucial $1.27 support. This level is in line with the 23.6% Fibonacci retracement which is often seen as a “floor” of support in bear market phases. Maintaining this area is important to prevent a deeper correction.
If the capitulation phase subsides and macro conditions improve, XRP has a chance to bounce off $1.27 and test the downtrend line formed since January. A break above $1.51 could confirm a change in the structure of the movement, as well as coincide with the 61.8% Fibonacci retracement that is often used as a recovery benchmark.
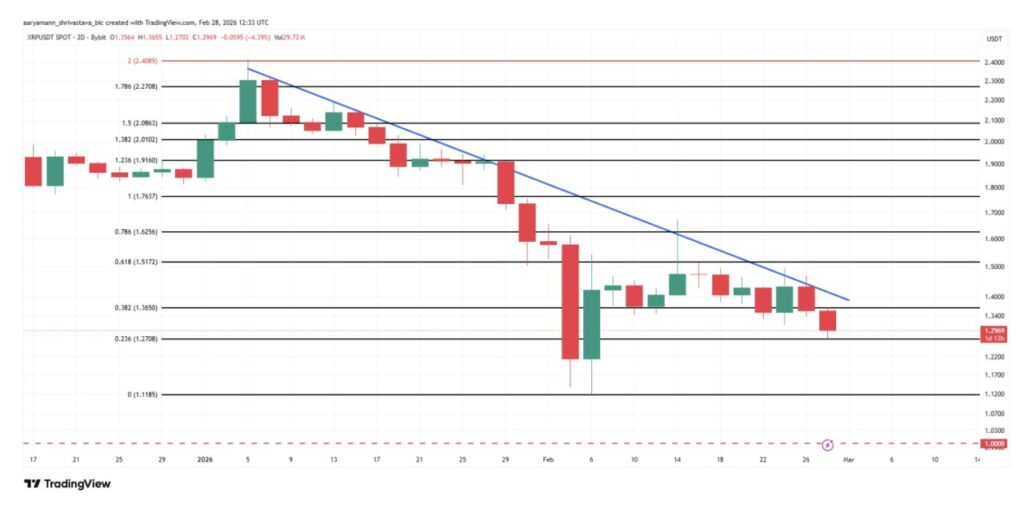
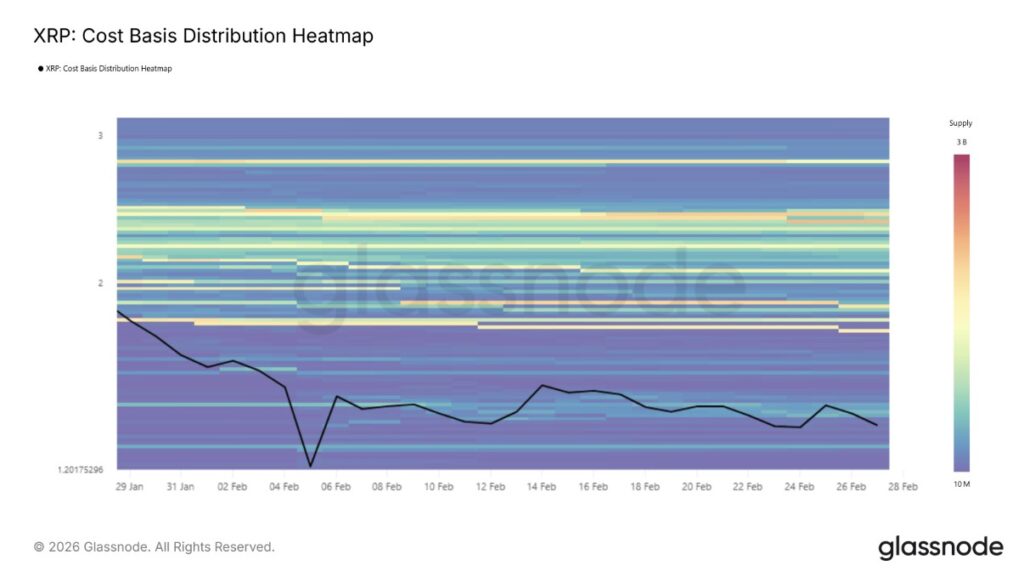
On-chain data indicates relatively limited resistance to the $1.76-$1.80 range. About 1.85 billion XRP is accumulated in this zone with a value close to $2.83 billion. Holders who bought in the area may be encouraged to sell to break even, creating temporary resistance.
Conversely, if $1.27 fails to hold, the bullish scenario weakens. A drop below the bearish market support “floor” could push XRP towards $1.11. If global uncertainty persists, a flat consolidation is also still possible. Thus, March presents a combination of risks and opportunities for XRP price recovery.
Follow us on Google News to stay up to date with the latest in crypto and blockchain technology. Check Bitcoin price, usdt to idr and tokenized nvidia stock price through Pintu Market.
Enjoy an easy and secure crypto trading and crypto gold investment experience by downloading the Pintu crypto app via Play Store or App Store now. Also, experience web trading with advanced trading tools such as pro charting, various order types, and portfolio tracker only at Pintu Pro.
*Disclaimer
This content aims to enrich readers’ information. Pintu collects this information from various relevant sources and is not influenced by outside parties. Note that an asset’s past performance does not determine its projected future performance. Crypto trading activities are subject to high risk and volatility, always do your own research and use cold hard cash before investing. All activities of buying and selling Bitcoin and other crypto asset investments are the responsibility of the reader.
Reference:
- BeInCrypto. XRP Price Prediction March 2026. Accessed on March 2, 2026
Latest News
© 2026 PT Pintu Kemana Saja. All Rights Reserved.
The trading of crypto assets is carried out by PT Pintu Kemana Saja, a licensed and regulated Digital Financial Asset Trader supervised by the Financial Services Authority (OJK), and a member of PT Central Finansial X (CFX) and PT Kliring Komoditi Indonesia (KKI). Crypto asset trading is a high-risk activity. PT Pintu Kemana Saja do not provide any investment and/or crypto asset product recommendations. Users are responsible for thoroughly understanding all aspects related to crypto asset trading (including associated risks) and the use of the application. All decisions related to crypto asset and/or crypto asset futures contract trading are made independently by the user.