5 SHIB Oversold Signals: 20% Rebound Chance Amidst a Still Sluggish Crypto Market!
Jakarta, Pintu News – Shiba Inu (SHIB) is back in the spotlight of cryptocurrency investors after a long period of price pressure and moving below the major moving averages. This confirms the dominance of the bearish trend, but at the same time raises the suspicion of “seller fatigue” which is often the trigger for short-term bounces. While the crypto market is still sensitive to global sentiment-including the movements of Bitcoin (BTC) and Ethereum (ETH)-a number of technical indicators signal that SHIB is entering a reset phase that you should understand objectively.
1. Price Below Moving Average: Bearish Trend Still Leading
SHIB is below several important moving averages, which is generally read as a downtrend structure. The lower high and lower low pattern suggests that the previous recovery is likely to be broken by renewed selling pressure. For novice investors, this means that a “rebound” scenario does not automatically equal a “trend reversal” in the medium term.
When the price is below the moving average, the recovery area often turns into a dynamic resistance. This means that any bounce could face a resale, especially if volume is not favorable. In the context of cryptocurrencies, such situations often give rise to short relief rallies without changing the direction of the main trend.
Also Read: 5 Important Things About Gold Bullion, the Most Solid Safe Haven Instrument Other Than Crypto!
2. Low RSI: An Oversold Indicator that Often Triggers Bounces
A Relative Strength Index (RSI) in the lower area usually indicates that selling pressure has taken the price into historically weak territory. In this phase, sellers often start to lose steam, leaving more room for a technical bounce. However, an oversold RSI should still be read as a signal of opportunity, not a certainty of trend reversal.
For easier understanding, the technical points can be summarized as follows:
- Low RSI indicates weak selling momentum, so the chances of a short-term bounce increase.
- Oversold is not automatically bullish because the big trend can still go down even if the RSI is already low.
- Confirmation generally comes from an increase in volume and the ability of price to hold above nearby key levels.
If you’re using RSI, focus on the change in price behavior after an oversold condition appears. A healthy bounce is usually evident from a small higher low and increased buyer participation. Without that, the price risks staying “oversold longer” before actually bouncing.
3. Candle Shrinks: The Decline is No Longer Aggressive
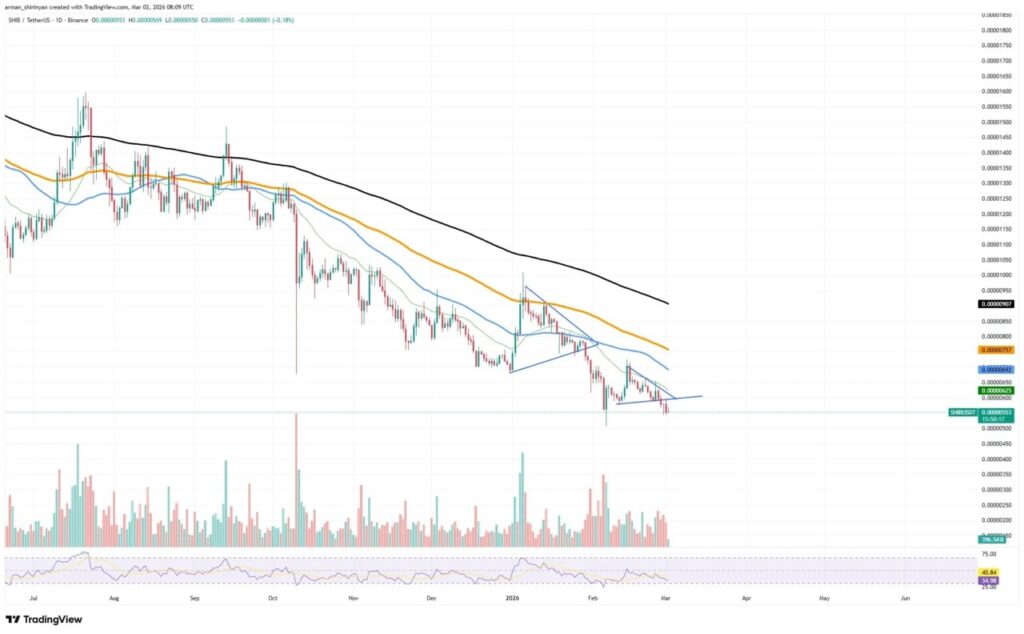
One of the signals that often comes ahead of a pause in selling pressure is a shrinking candle size. When candles become shorter and the direction of movement is indistinct, the market is often entering a phase of seeking equilibrium after a sharp decline. This may indicate a reduced supply of sellers, though it doesn’t necessarily mean buyers are taking control.
This phenomenon is important because relief rallies are often born from declines that lose momentum. In volatile crypto conditions, changes in “speed of descent” can be as important as direction. However, if there is no catalyst or support of broader market sentiment, this weakening of selling pressure could end up as a flat consolidation.
4. Consolidation Narrows: Potential Accumulation, but Still Fragile
SHIB’s price structure is said to have started forming a narrowing range with a tendency to stabilize from local lows. In technical analysis, this pattern is often associated with consolidation and potential accumulation after a long down phase. For you, this means that the market is starting to “reconsider” valuations, rather than immediately confirming an uptrend.
On the other hand, consolidation in bearish trends is often temporary and vulnerable to breakdown if sentiment worsens. Therefore, the bounce that occurs needs to be tested at the nearest resistance. Without a consistent break of resistance, the consolidation risks just being a pause before further declines.
5. 15-20% Relief Rally Scenario: Realistic, but Risks Remain
In the most realistic scenario, SHIB is likely to experience a relief rally towards the nearest resistance with a potential upside of around 15-20%. Such rallies are often triggered by a combination of technical factors, including oversold conditions, falling volatility, and short covering. However, as long as the moving averages remain bearish, the rally is likely to be limited if there is no change in the broader cryptocurrency market sentiment.
To keep your reading balanced, consider the following risk summary:
- A 15-20% rebound makes more sense as a short-term recovery, not a confirmation of a new bullish trend.
- The dynamic resistance of the moving average may become a resell area.
- Without the support of improved crypto market sentiment, the rally risks quickly weakening and returning to consolidation.
In conclusion, SHIB is in the “reset zone” which opens up opportunities for technical bounces, but the main trend is still bearish. If you are considering a short-term strategy, focus on confirmation (volume, higher low structure, and response at resistance). If you are long-term oriented, oversold signals should be positioned as additional data, not the only basis for decisions.
Also Read: 5 Advantages of Pegadaian Gold Deposit
Follow us on Google News to stay up to date with the latest in crypto and blockchain technology. Check Bitcoin price, usdt to idr and tokenized nvidia stock price through Pintu Market.
Enjoy an easy and secure crypto trading and crypto gold investment experience by downloading the Pintu crypto app via Play Store or App Store now. Also, experience web trading with advanced trading tools such as pro charting, various order types, and portfolio tracker only at Pintu Pro.
*Disclaimer
This content aims to enrich readers’ information. Pintu collects this information from various relevant sources and is not influenced by outside parties. Note that an asset’s past performance does not determine its projected future performance. Trading crypto carries high risk and volatility, always do your own research and use cold hard cash beforeinvesting. All activities of buying and selling Bitcoin (BTC) and other crypto asset investments are the responsibility of the reader.
Reference
- U.Today. Shiba Inu (SHIB) Price Reset Point: Three Oversold Indicators, 20% Potential. Accessed March 3, 2026.
Latest News
UBS Gold Price Today, April 29, 2026
UBS Gold Price Today, April 29, 2026
© 2026 PT Pintu Kemana Saja. All Rights Reserved.
The trading of crypto assets is carried out by PT Pintu Kemana Saja, a licensed and regulated Digital Financial Asset Trader supervised by the Financial Services Authority (OJK), and a member of PT Central Finansial X (CFX) and PT Kliring Komoditi Indonesia (KKI). Crypto asset trading is a high-risk activity. PT Pintu Kemana Saja do not provide any investment and/or crypto asset product recommendations. Users are responsible for thoroughly understanding all aspects related to crypto asset trading (including associated risks) and the use of the application. All decisions related to crypto asset and/or crypto asset futures contract trading are made independently by the user.