7 ETH Signals in March 2026: $1,320 Target vs $2,590 Rebound
Jakarta, Pintu News – Ethereum (ETH) entered March 2026 under heavy pressure after recording consecutive monthly declines since September 2025, accompanied by a February correction that approached 20%. Amid a still volatile crypto and cryptocurrency market, the ETH narrative is now split: one side sees bearish signals continuing, the other side highlights the chance of a relief rally if short-term indicators strengthen. The following is an educational summary based on technical levels, institutional flows, and hodler behavior, with a conversion of 1 USD = IDR 16,861.
1. Six Red Months in a Row: Why is this a highlight?
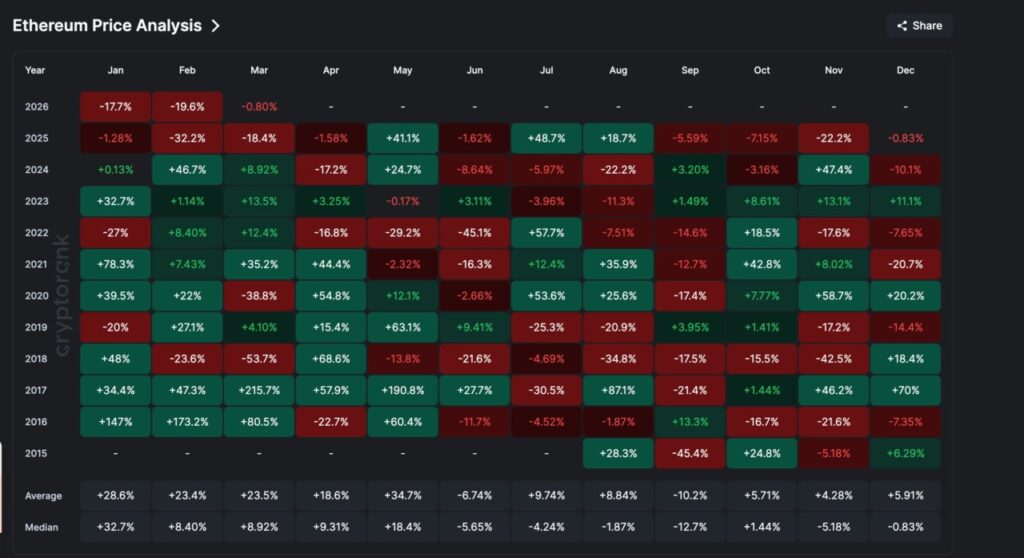
The long series of monthly declines has put ETH into a “fragile sentiment” phase as recoveries are often perceived as temporary bounces. When the downtrend becomes dominant, many market participants focus more on capital protection than chasing the upside. This usually magnifies the role of technical levels as markets seek objective benchmarks amidst uncertainty.
Historically, March is often seen as a more constructive month for certain crypto assets, but seasonal statistics don’t always apply when the trend structure changes. In the current context, the main question is not just “whether it can go up,” but rather “whether the upside signal is strong enough to change the trend.” As such, novice investors need to distinguish between short-term rebounds and trend reversals.
Also Read: 5 Important Things About Gold Bullion, the Most Solid Safe Haven Instrument Other Than Crypto!
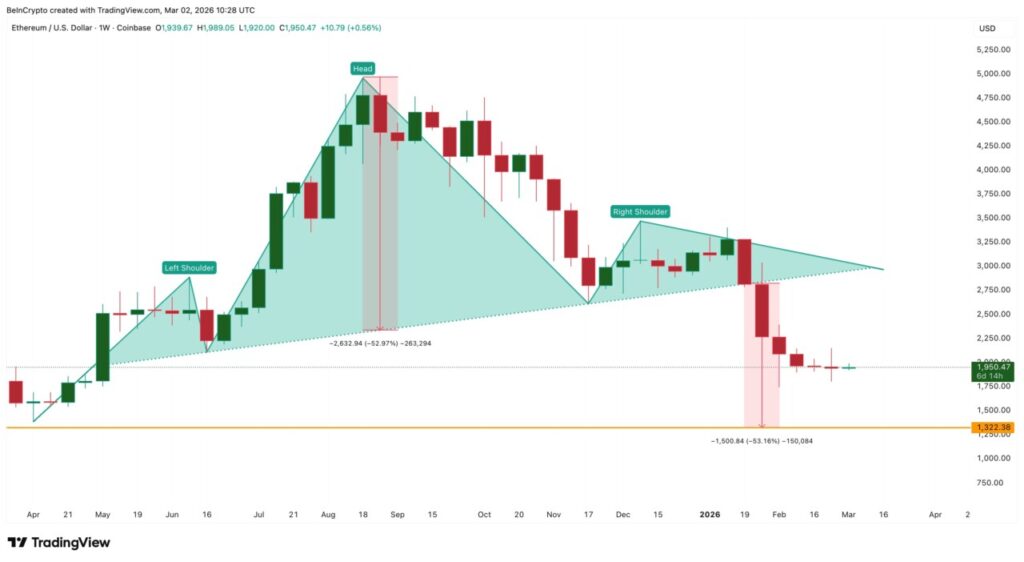
2. Weekly Head and Shoulders Pattern: $1.320 Target Still Lurking
On the weekly framework, technical readings highlighted a head and shoulders pattern associated with continued downside risks. The projection often associated with this pattern points to around $1,320, or roughly IDR 22,246,520. As long as the target and structure of the pattern are considered “active,” the market usually continues to assess the risk of breakdown as still present.
Summary of relevant levels for you to monitor:
- The so-called bearish target: $1,320 ≈ IDR 22,246,520
- Risk increases if the price fails to defend the latest local support
- The pattern is still seen as valid as long as there is no clear reversal of the structure
Importantly, technical targets are probabilistic scenarios, not certainties. But in bearish phases, markets are often more responsive to down scenarios as liquidity and sentiment tend to be defensive. As such, risk management is usually more dominant than seasonal optimism.
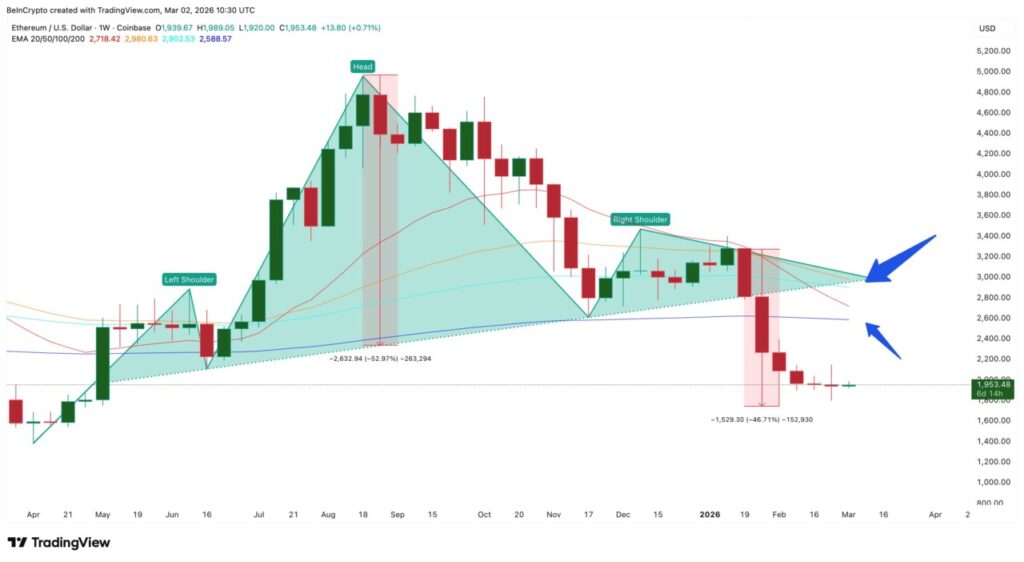
3. EMA Signal: Bearish Crossover Could Confirm Trend
In addition to the price pattern, the weekly exponential moving average (EMA) readings are also of interest due to a potential bearish crossover. This kind of crossover is often used as a lagging indicator, but it still affects market psychology as many traders use it as a trend reference. If the crossover is confirmed, the market could see that downward pressure has additional technical “justification”.
In practice, EMA does not predict new events, but rather summarizes trends that are already underway. However, when two bearish signals appear close together, the chances of a sustained rally are usually more difficult without an additional catalyst. For you, this signal is best used as a risk context, not as the sole basis for a decision.
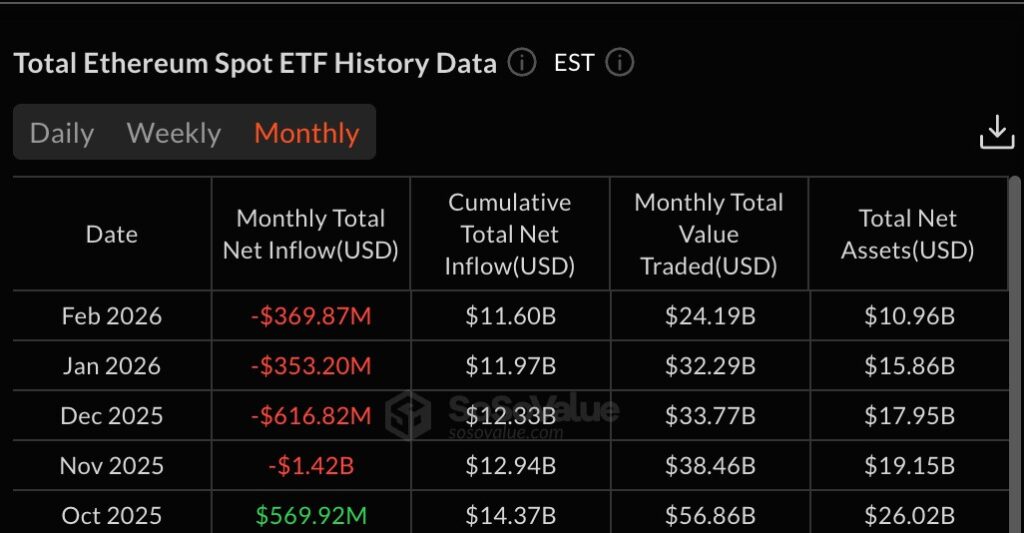
4. Institutional Flows: ETH ETF Outflows Strengthen, Differently from BTC
One factor adding to the pressure is the continued outflows of the so-called Ethereum ETF. February 2026 is said to have recorded net outflows of $369.87 million (≈ IDR6,235,249,070,000), greater than January’s $353.20 million (≈ IDR5,954,815,200,000). Consecutive months of outflow trend indicates reduced demand support from institutional channel.
As a comparative narrative, Bitcoin (BTC) is often cited as starting to see a slowdown in outflow pressure in certain phases, while ETH has yet to show similar stabilization. In the cryptocurrency market, institutional flows can affect the demand “floor” as it provides a layer of buyers that is not always present in the retail market. If outflows persist, ETH’s rally is more dependent on retail spot demand and inter-asset rotation in the crypto ecosystem.
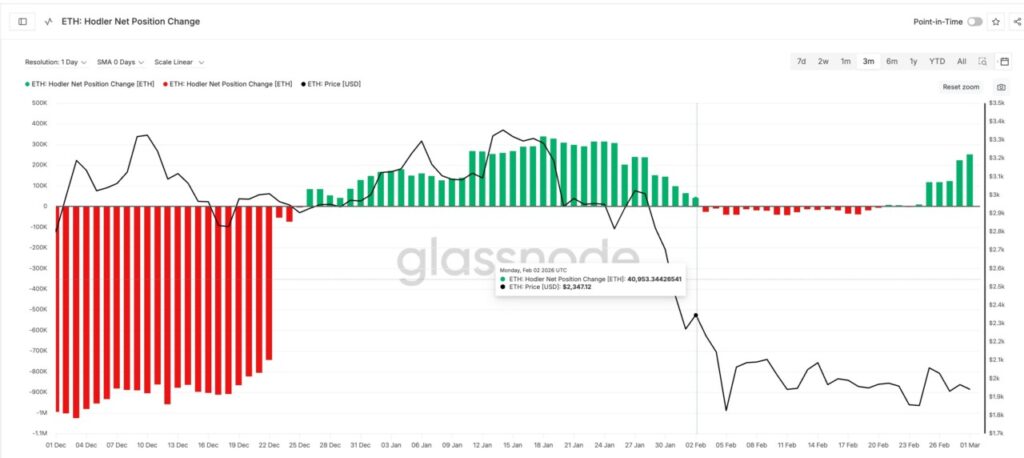
5. Hodler Buys: Strong Signal or Average Down Attempt?
On the other hand, on-chain data highlighted a spike in hodler net position change indicating increased buying. The highlighted figure is +252,142 ETH, up from +6,829 ETH in the previous period, which is often read as an intensification of accumulation. However, the interpretation needs to be neutral as accumulation could be due to conviction, or due to investors averaging down to fix the average price.
In short, two equally plausible readings:
- Bullish: accumulation signals medium-term confidence is returning
- Neutral/Cautious: buying occurs because many holders are “stuck” and want to lower average cost
Therefore, hodler data is stronger when aligned with price structure improvement and volume recovery. Without technical support, accumulation may arrest a temporary decline, but not necessarily trigger an uptrend.
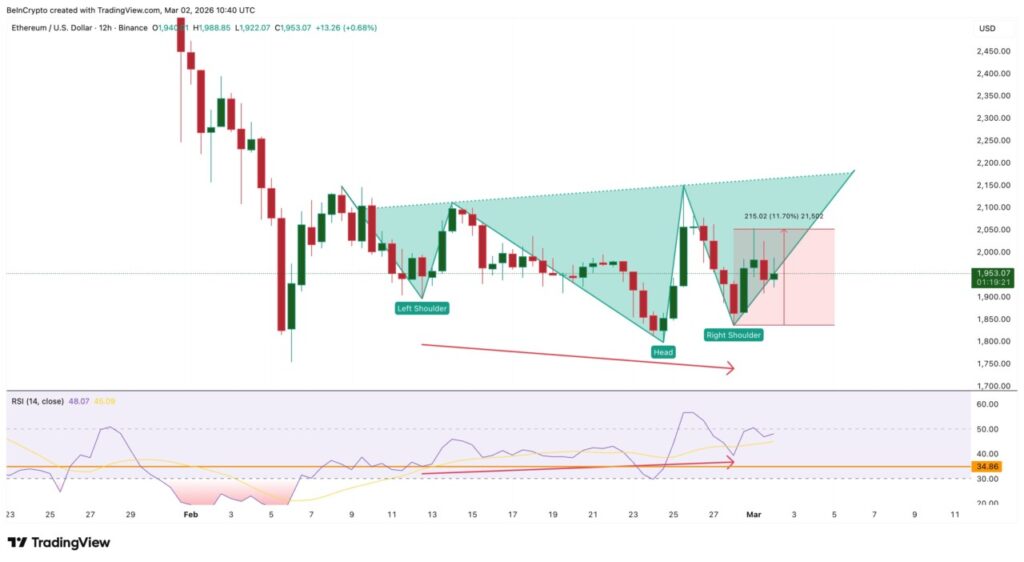
6. 12 Hour RSI Divergence: Hope for Short-Term Rally Relief
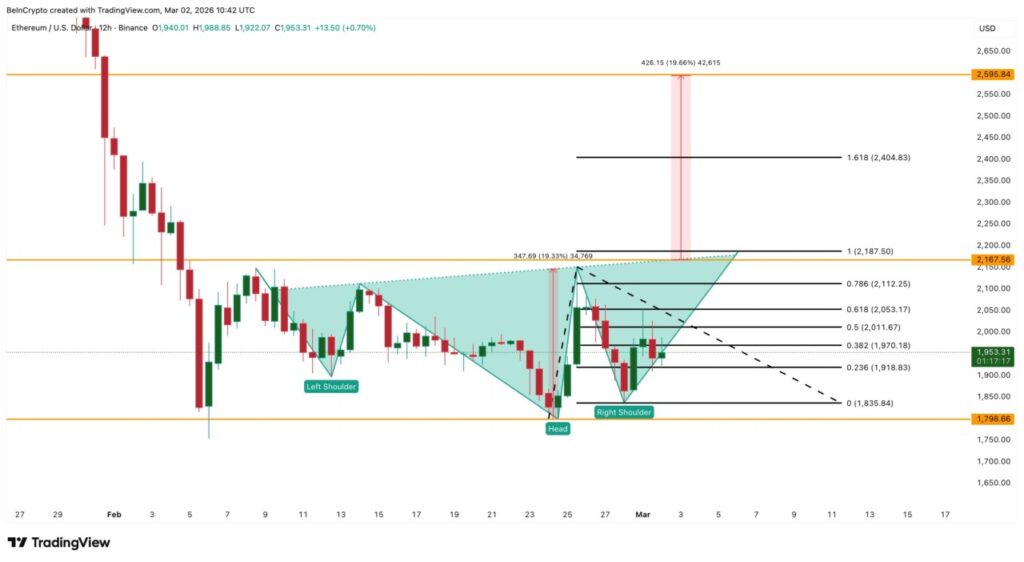
On the 12-hour timeframe, the RSI reading shows a bullish divergence, where the price makes a lower low while the RSI makes a higher low. This pattern often triggers a relief rally as it signals the downward momentum is weakening. It is also called an inverse head and shoulders pattern which, if confirmed, could change the short-term bias.
Technical levels are often used as a “test” for this scenario:
- Neckline: $2,160-$2,180 ≈ Rp36,419,760-Rp36,756,980
- Rebound target: $2,590 ≈ IDR 43,670,990
- Scenario cancellation limit: $1,790 ≈ Rp30,179,190
For you, the point of the reading is confirmation. The divergence could fail if the price is unable to break the neckline or if the crypto market turns risk-off again. Therefore, this signal is more appropriately seen as a short-term opportunity with risks remaining high.
7. March 2026: Turning Point or Continuation of Trend?
Overall, ETH is at a crossroads: the weekly signal is still heavy, but the 12-hour signal opens up bounce opportunities. If institutional flows remain out and trend signals (weekly EMA/pattern) do not improve, the market is likely to maintain a bearish bias. On the contrary, if the relief rally continues and breaks the neckline area, the chances of recovery to short-term targets become more plausible.
For novice investors, the rational approach is to map out scenarios, rather than locking into one narrative. A 10-20% rebound can happen without changing the major trend, while a continued breakdown can appear despite the accumulation of hodlers. In crypto and cryptocurrency markets, discipline at key levels and risk management are usually more decisive than a single prediction.
Also Read: 5 Advantages of Pegadaian Gold Deposit
Follow us on Google News to stay up to date with the latest in crypto and blockchain technology. Check Bitcoin price, usdt to idr and tokenized nvidia stock price through Pintu Market.
Enjoy an easy and secure crypto trading and crypto gold investment experience by downloading the Pintu crypto app via Play Store or App Store now. Also, experience web trading with advanced trading tools such as pro charting, various order types, and portfolio tracker only at Pintu Pro.
*Disclaimer
This content aims to enrich readers’ information. Pintu collects this information from various relevant sources and is not influenced by outside parties. Note that an asset’s past performance does not determine its projected future performance. Trading crypto carries high risk and volatility, always do your own research and use cold hard cash beforeinvesting. All activities of buying and selling Bitcoin (BTC) and other crypto asset investments are the responsibility of the reader.
Reference
- BeInCrypto. Ethereum Price Prediction March 2026: What To Expect From ETH In March 2026. Accessed March 3, 2026.
Latest News
© 2026 PT Pintu Kemana Saja. All Rights Reserved.
The trading of crypto assets is carried out by PT Pintu Kemana Saja, a licensed and regulated Digital Financial Asset Trader supervised by the Financial Services Authority (OJK), and a member of PT Central Finansial X (CFX) and PT Kliring Komoditi Indonesia (KKI). Crypto asset trading is a high-risk activity. PT Pintu Kemana Saja do not provide any investment and/or crypto asset product recommendations. Users are responsible for thoroughly understanding all aspects related to crypto asset trading (including associated risks) and the use of the application. All decisions related to crypto asset and/or crypto asset futures contract trading are made independently by the user.