3 Altcoins That May Outshine Bitcoin in March 2026
Jakarta, Pintu News – Bitcoin (BTC) is still moving in a consolidation phase under strong selling pressure. Although this condition should be watched out for, the situation can also open up opportunities.
Historically, the best moves in altcoins don’t usually occur when Bitcoin takes off. Instead, altcoin momentum tends to emerge when Bitcoin goes sideways or begins to recover.
With three important catalysts converging in March 2026, Polkadot (DOT), Pi Network (PI), and XRP (XRP) stand out as the altcoins with the most potential to outperform the market this month.
Polkadot (DOT)
Polkadot has an exact date that the market can reference. On March 14, 2026-“Pi Day”-the network will execute a community-approved tokenomic overhaul.
Read also: Meme Coin Price Predictions: Dogecoin, Shiba Inu, and Pepe Signal Bearish at Crucial Levels
The annual token issuance dropped from 120 million to 56.88 million DOTs, reducing inflation from around 10% to 3.11%. Simultaneously, a hard cap of 2.1 billion DOTs also came into effect.
This change can be seen as the Bitcoin equivalent of “halving” the DOT. In addition, two large ETF filings from Grayscale and 21Shares reinforce the institutional access narrative in parallel.
Polkadot is currently working on forming a clearer trend structure. DOT was trading at $1.58, down 1.86% on the day. However, the daily chart shows the most constructive configuration in recent months.
The descending channel that has held DOT prices since October is now being tested. The price briefly bounced off the zero Fib level at $1,117 earlier this week. However, the current candle is pressuring the area again. A daily close above the channel’s trend line would be the first break of the structure in over four months.
The Supertrend Indicator (10, 3) is at $1.22, now below the price after reversing earlier this week. The DOT is still holding above it. This is an important signal. Every time the Polkadot price closes daily above $1.224, the bullish Supertrend reading is confirmed.
MACD also corroborated the change in direction. The MACD line (0.054) has surpassed the signal line (-0.025), and the histogram bars turned green-marking the first bullish crossover on the daily chart since the downtrend began.
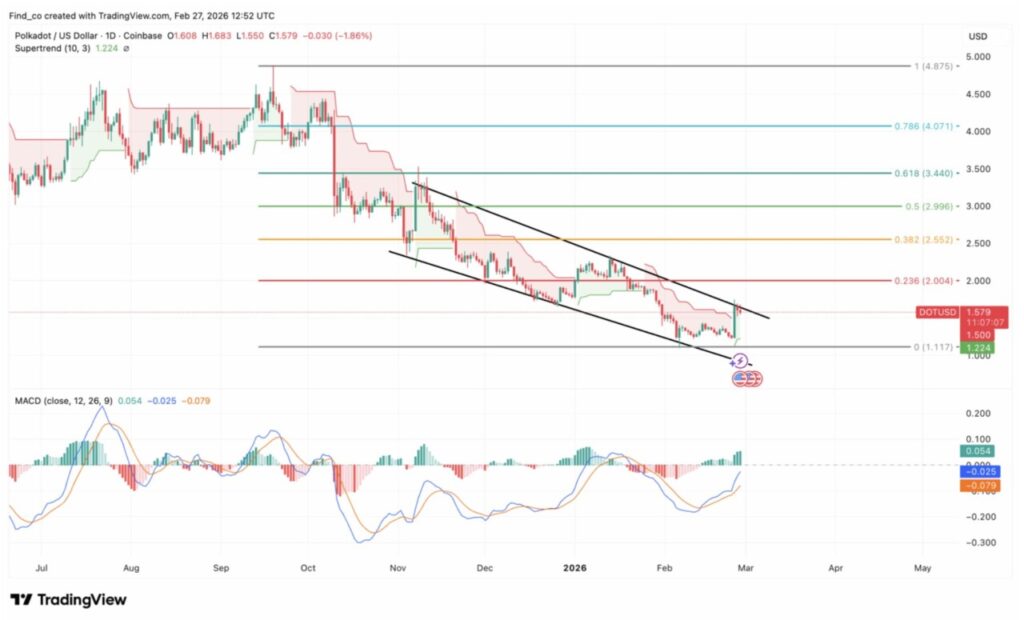
The signal line is still in negative territory (-0.025), so this crossover is still relatively new and untested, but the direction of movement remains clear. The initial target above the channel is at $2,004 (Fib 0.236), or about 27% of the current price level.
However, if demand for DOT and other altcoins weakens throughout March, this projection could potentially not materialize. In that scenario, DOT could fall back towards $1.12.
Pi Network (PI)
Pi Network is the choice with the highest risk profile as well as the largest potential return among the three altcoins discussed. Currently, the asset is more than 95% below its February 2025 record high of $2.98.
The project is actively expanding the open mainnet; around 2.5 million previously restricted users were recently re-opened for migration.
In addition, Pi App Studio was updated in January 2026 with a no-code payment integration tool. At the same time, speculation about an exchange listing has also intensified, with Kraken often mentioned as one of the candidates.
Because of this, the risk-reward profile becomes asymmetric. In this context, any confirmation of a large listing in March has the potential to trigger a very rapid spike in performance relative to Bitcoin.
Pi Network is now attempting a breakout from its tightest compression phase since listing. At the time of writing, PI is trading at $0.17 and has just broken above the descending channel.
Since its post-launch peak in June at around $0.6661, PI has corrected more than 74% in a consistent downtrend, breaking almost all Fibonacci levels-0.786, 0.618, 0.5, 0.382, and 0.236-without any meaningful recovery.
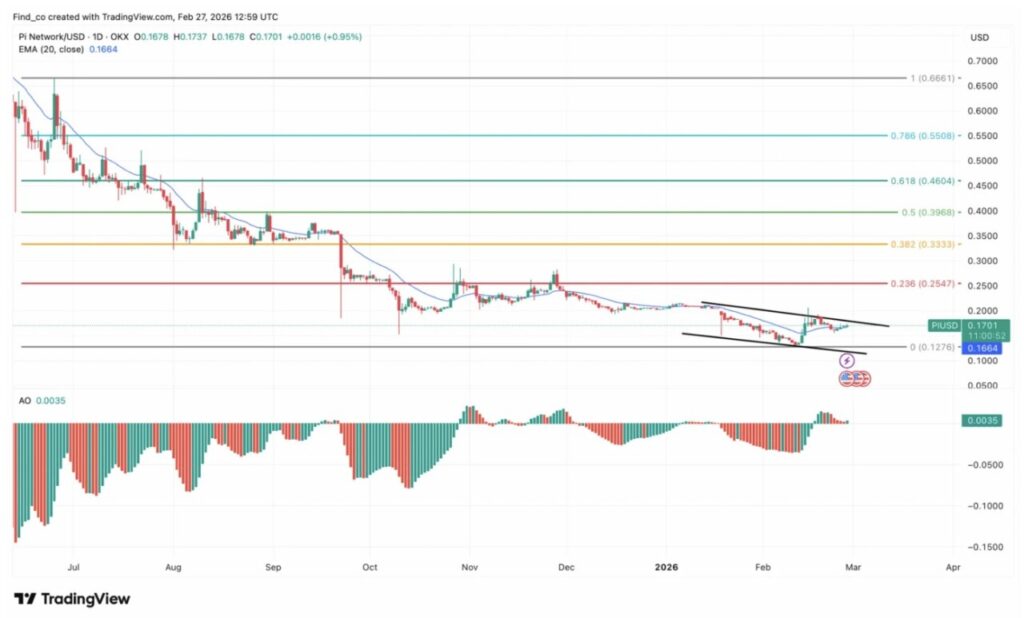
The zero Fib level at $0.1276 became the last line of defense before entering the uncharted price area. The main change this week was in the microstructure. The downward channel formed in January and February pushed the PI price further compressed towards the $0.1276 area.
Now, the price has broken the upper limit of the channel and reclaimed the 20-EMA at $0.1664-and is trading above it for the first time in weeks.
Read also: What Can We Expect from Pi Network in March 2026?
The Awesome Oscillator (AO) at 0.0035 has just crossed above the zero level. The numbers are thin, but the direction of the shift is important. If this momentum holds, a more relevant initial target would be at $0.25 (Fib 0.236), equivalent to about 50% upside potential from current levels.
That is the minimum threshold that the bullish camp needs to reclaim to indicate that a recovery phase is taking shape. However, PI still needs a consistent price close above $0.17 to ensure that the breakout is valid, not just another false signal that fails again.
XRP
XRP has the strongest structural foundation of the three. The SEC lawsuit expires in August 2025, thus removing the biggest obstacle that for five years suppressed institutional participation.
Since November 2025, spot XRP ETFs reportedly attracted inflows of $1.37 billion, with Franklin Templeton as one of the main drivers.
In addition, the XRP Ledger is preparing for a major update in 2026, including the addition of zero-knowledge proofs as well as a native lending protocol that directly targets institutional DeFi users. As such, XRP’s position is underpinned by a stack of catalysts that reinforce each other, rather than stand alone.
Technically, XRP is pressing a decisive level. The token is trading at $1.38, down 1.63% on the day, and is right at the apex area of a large descending triangle that has been compressing prices since the top of July.
The structure is clear. A descending upper trendline capped every rally since August, with successive rejections at $3.20, $2.80, $2.40, then $2.10. On the downside, a flat support area around $1.20 held on each test. Both lines are now converging around the current price.
The chart also shows a potential target of $2.0883 (Fib 0.382) in case of a breakout above the trendline. That equates to about 51% upside from current levels. The MACD is the first constructive signal in months. The MACD line (0.0145) has crossed the signal line (-0.0709).
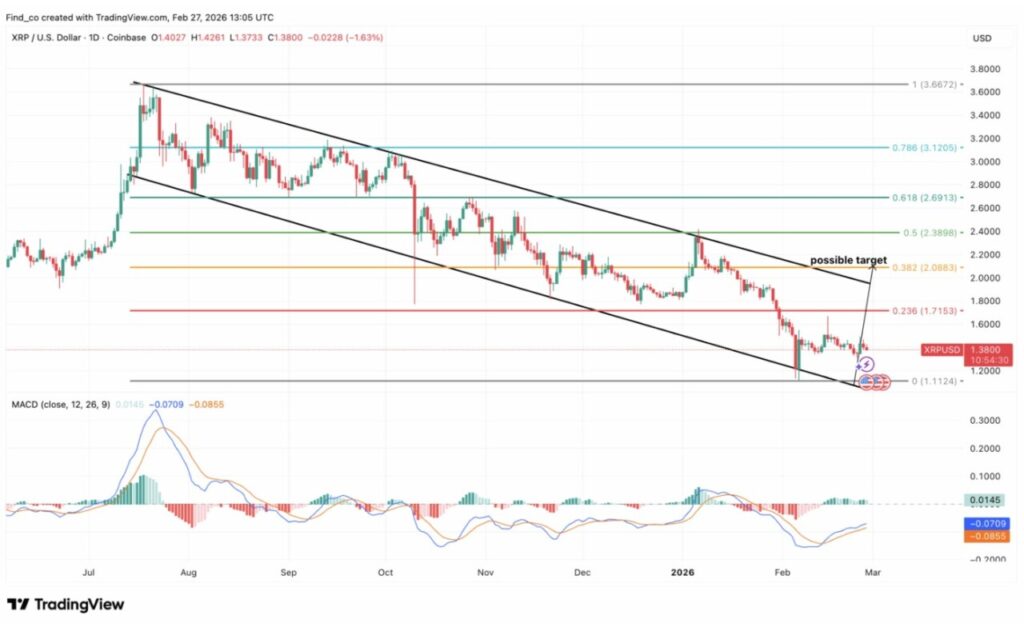
However, the signal line is still in negative territory (-0.0855), so this crossover is early and vulnerable. However, the direction has changed.
A daily close above the downtrend line-currently around $1.50-would activate a bullish scenario towards $1.7153 (Fib 0.236) as an initial target, then continue to $2.09.
Conversely, a drop below $1.20 will invalidate the triangle support and open a path towards the zero Fib level of $1.1124.
Follow us on Google News to stay up to date with the latest in crypto and blockchain technology. Check Bitcoin price, usdt to idr and tokenized nvidia stock price through Pintu Market.
Enjoy an easy and secure crypto trading and crypto gold investment experience by downloading the Pintu crypto app via Play Store or App Store now. Also, experience web trading with advanced trading tools such as pro charting, various order types, and portfolio tracker only at Pintu Pro.
*Disclaimer
This content aims to enrich readers’ information. Pintu collects this information from various relevant sources and is not influenced by outside parties. Note that an asset’s past performance does not determine its projected future performance. Crypto trading activities are subject to high risk and volatility, always do your own research and use cold hard cash before investing. All activities of buying and selling Bitcoin and other crypto asset investments are the responsibility of the reader.
Reference:
- CCN. Altcoin March 2026: DOT, PI, XRP Risk Upside as Bitcoin (BTC) Analysis. Accessed on March 2, 2026
Latest News
© 2026 PT Pintu Kemana Saja. All Rights Reserved.
The trading of crypto assets is carried out by PT Pintu Kemana Saja, a licensed and regulated Digital Financial Asset Trader supervised by the Financial Services Authority (OJK), and a member of PT Central Finansial X (CFX) and PT Kliring Komoditi Indonesia (KKI). Crypto asset trading is a high-risk activity. PT Pintu Kemana Saja do not provide any investment and/or crypto asset product recommendations. Users are responsible for thoroughly understanding all aspects related to crypto asset trading (including associated risks) and the use of the application. All decisions related to crypto asset and/or crypto asset futures contract trading are made independently by the user.