Solana’s 7 Critical Levels: IDR1.69M test could pave the way to IDR1.89M?
Jakarta, Pintu News – Solana (SOL) has rallied again and entered a consolidation phase after breaking several short-term technical levels. In the latest move, SOL stabilized above the $90 area, while crypto market participants are monitoring the potential continuation of the rally if the price is able to break $95 to $100. The main focus now is whether the cryptocurrency can maintain its upward momentum without experiencing a deeper correction.
Technically, the report said that SOL started to strengthen after holding above $85, then breaking $88 and $90. The price briefly formed a local peak at $94.10 before correcting mildly and then moving consolidatively. In the context of crypto and cryptocurrencies, consolidation phases like this are often read as a pause before the next trend direction is confirmed.
1. SOL Strengthens from $85-$88 Area and Breaks $90
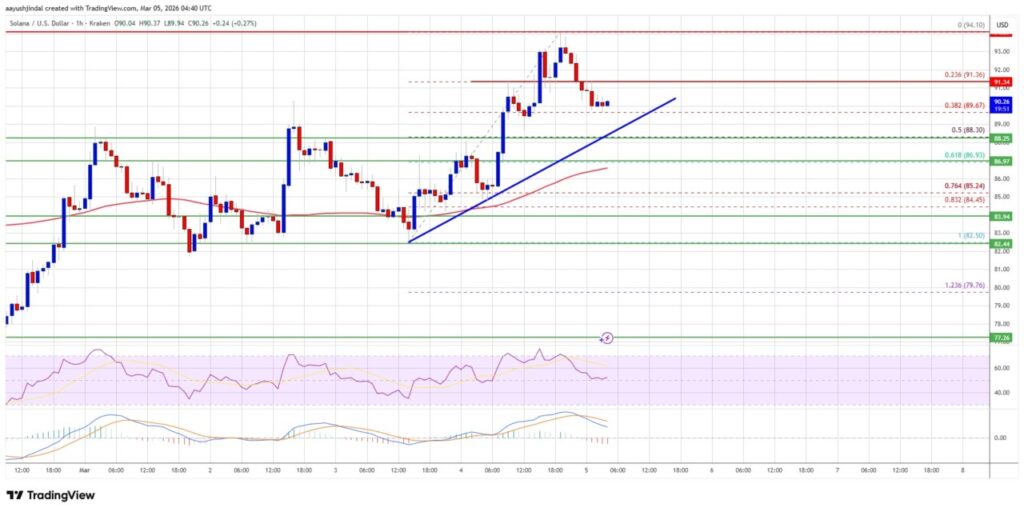
Solana (SOL) is said to have started a new upswing after “settling” above $85, then continuing past $88. The buying impulse then took the price through the $90 resistance and even briefly surpassed $92. At this phase, the crypto market usually judges the strength of the trend by the ability of the price to hold above the breakout level.
A local peak was reportedly formed at $94.10 before the price entered consolidation. There was a minor correction that briefly broke below the 23.6% Fibonacci level of the $82.50 to $94.10 rise, but there was no mention of a trend reversal. For novice cryptocurrency investors, this illustrates that strong gains can still be accompanied by small pullbacks without immediately changing the trend structure.
Also Read: Czech Central Bank seeks 100 tons of gold reserves, Bitcoin (BTC) is still under consideration
2. $95 Level and $100 Psychological Test in Focus
On the upside, the closest resistance is said to be around $92, then the bigger level at $95. If SOL manages to clear $95, the market’s attention turns to the psychological resistance of $100 which often triggers short-term changes in sentiment. A strong price close above $100 is said to have the potential to open up further upside space.
If the bullish scenario continues, the next resistance targets are said to be at $108 and $112. These levels are usually used by crypto traders as an evaluation point for whether the uptrend is still healthy or starting to get saturated. To summarize, the upside path will be more credible if the price is able to stay above $100, not just touch it intraday.
Conversion rate 1 USD = IDR16,919 for major resistance levels:
- $95 ≈ Rp1,607,305
- $100 ≈ Rp1,691,900
- $108 ≈ Rp1,827,252
- $112 ≈ Rp1,894,928
3. Support $90-$88.50 Defines Correction Risk
If SOL fails to break $92, reports say there is a chance of further correction. Initial support is at $90, then the next major support at $88.50 which is also related to the trendline as well as the 50% Fibonacci level from the $82.50 to $94.10 rise. For cryptocurrency investors, these areas are important as they are often the “borderline” between a healthy correction and deeper weakness.
A break below $88.50 is said to direct the price towards the $84 area. If $84 does not hold and a close below it occurs, the downside risk could resume towards $78 in the near term. In other words, the short-term bullish structure will be better preserved as long as SOL is able to stay above the $88.50-$90 zone.
Conversion rate 1 USD = IDR16,919 for the main support level:
- $90 ≈ Rp1,522,710
- $88.50 ≈ Rp1,497,331.5
- $84 ≈ Rp1,421,196
- $78 ≈ Rp1,319,682
4. Momentum Indicators: RSI Above 50, MACD Begins to Lose Power
In terms of indicators, the hourly RSI is reported to be above the 50 level, which generally indicates that the bullish bias is still present on the short timeframe. However, the hourly MACD is said to be losing momentum in the bullish zone, which could mean that the rate of increase is slowing down although the trend is not necessarily reversing. This combination is often read as a “need confirmation” signal through a breakout of the next resistance level.
For those of you who are new to technical analysis in the crypto market, the gist of these indicators is simple. The RSI helps see if the buying impulse is relatively dominant, while the MACD helps monitor the acceleration or deceleration of the trend. If the price is able to break $95-$100 when momentum returns, then the chances of a continuation of the rally are usually considered to increase.
Also Read: 700% Crypto Withdrawal Surge in Iran: Bitcoin becomes a financial escape route during crisis
Follow us on Google News to stay up to date with the latest in crypto and blockchain technology. Check Bitcoin price, usdt to idr and tokenized nvidia stock price through Pintu Market.
Enjoy an easy and secure crypto trading and crypto gold investment experience by downloading the Pintu crypto app via Play Store or App Store now. Also, experience web trading with advanced trading tools such as pro charting, various order types, and portfolio tracker only at Pintu Pro.
*Disclaimer
This content aims to enrich readers’ information. Pintu collects this information from various relevant sources and is not influenced by outside parties. Note that an asset’s past performance does not determine its projected future performance. Trading crypto carries high risk and volatility, always do your own research and use cold hard cash beforeinvesting. All activities of buying and selling Bitcoin (BTC) and other crypto asset investments are the responsibility of the reader.
Reference
- Aayush Jindal/NewsBTC. Solana (SOL) Rally Builds, Traders Watch Critical $100 Test. Accessed March 6, 2026.
Latest News
© 2026 PT Pintu Kemana Saja. All Rights Reserved.
The trading of crypto assets is carried out by PT Pintu Kemana Saja, a licensed and regulated Digital Financial Asset Trader supervised by the Financial Services Authority (OJK), and a member of PT Central Finansial X (CFX) and PT Kliring Komoditi Indonesia (KKI). Crypto asset trading is a high-risk activity. PT Pintu Kemana Saja do not provide any investment and/or crypto asset product recommendations. Users are responsible for thoroughly understanding all aspects related to crypto asset trading (including associated risks) and the use of the application. All decisions related to crypto asset and/or crypto asset futures contract trading are made independently by the user.