6 Bitcoin ETF Deficit Data IDR150 Trillion: Why is Wall Street Still Holding Back?
Jakarta, Pintu News – Bitcoin (BTC) broke through the $70,000 area again, but ETF fund flow data shows institutional sentiment has not fully recovered. Reports highlight that spot Bitcoin ETF holders in aggregate are still below the estimated average realized price, so some ETF investors are still holding losing positions. In the crypto and cryptocurrency market, the “below cost basis” condition often makes new buying interest slow down as market participants wait for trend confirmation.
On the other hand, large ETF outflows can also add to selling pressure in the spot market. When investors withdraw funds from ETFs, fund managers may need to redeem Bitcoin to fulfill redemptions, increasing the supply of BTC to the market. Therefore, a recovery in BTC prices does not always immediately follow a recovery in Wall Street’s risk appetite.
1. Spot Bitcoin ETF Cost Basis Estimated at $79,000
According to the report, the average estimated realized price of Bitcoin ETF spot holders stands at around $79,000. This means that, in aggregate, ETF investors are entering at a higher level than the price of BTC as the correction progresses.
At an exchange rate of 1 USD = IDR16,919, the $79,000 figure is equivalent to approximately IDR1,336,601,000. This difference between the market price and cost basis is referred to as the “deficit” that is holding back new buying interest.
It should be noted that this metric is positioned as an aggregate approach, not a reflection of each individual investor. However, as an indicator of capital behavior, it gives an idea of the average entry point of ETF fund flows.
Also Read: Czech Central Bank seeks 100 tons of gold reserves, Bitcoin (BTC) is still under consideration
2. ETF Outflows Reach $8.9 Billion from Peak
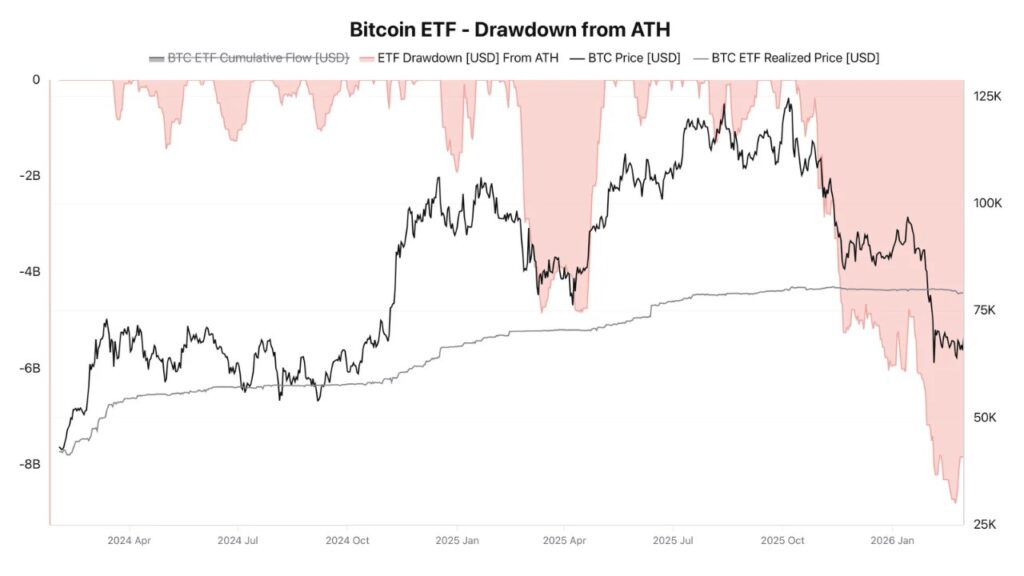
Reports say more than $8.9 billion exited the spot Bitcoin ETF ecosystem during the downturn, making it the largest drawdown from a record peak in invested value. Outflows like this generally occur when investors reduce exposure as volatility increases.
If converted, $8.9 billion is equivalent to around Rp150,579,100,000,000 or approximately Rp150.6 trillion. In the context of crypto, an outflow of this scale could affect spot market liquidity.
The impact is not only psychological, but also mechanical, as redemptions can force the sale of BTC by ETF products.
3. IBIT Said to Experience 42,000 BTC Withdrawal
The outflow pressure is evident in the largest product mentioned in the report, BlackRock’s iShares Bitcoin Trust (IBIT). At its peak, IBIT was said to have held more than 806,000 BTC, and then experienced cumulative outflows of more than 42,000 BTC.
When such a large portion is withdrawn, the implication is the potential addition of supply to the market if redemption requires the release of BTC. This could reinforce the downtrend, especially when the price is already in a correction phase.
For those of you who monitor the cryptocurrency market, this kind of data is often used to read whether the selling pressure is coming from retail investors, institutions, or a combination of both.
4. Signs of Easing: Drawdown Improves to Around $7.8 Billion
Although still negative, the report said the cumulative drawdown from the peak improved from around -$8.9 billion to around -$7.8 billion. This indicates that the pace of outflows is slowing down, although it has not yet turned into net inflows.
Conversion to rupiah shows a shift from around IDR150.6 trillion to around IDR131,968,200,000,000 or IDR132.0 trillion. This improvement can be read as a signal of initial stabilization, not a full recovery of risk appetite.
In the crypto market, changes in the rate of fund flows are often as important as the direction of the fund flows themselves.
5. BTC Seizes $70,000, But Still Below Key Resistance
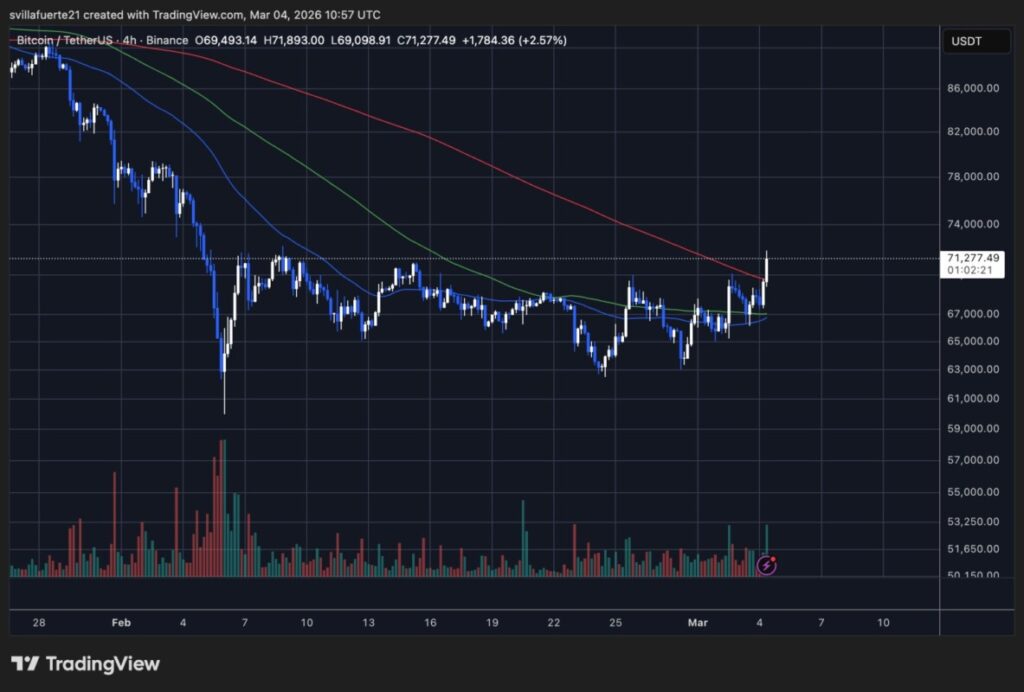
Technically, BTC is said to be reclaiming the 50-period moving average and testing the 100-period moving average on the 4-hour chart. This movement signals short-term momentum improvement after weeks of consolidation and a pattern of lower highs.
However, BTC is still below the 200-period moving average which is said to be in the mid-$70,000s area. This level is positioned as a key resistance to confirm a stronger trend reversal.
In essence, the rise above $70,000 improved the short-term structure, but not enough to erase the institutional caution reflected in the ETF data.
6. Technical Levels: $69,000 Determines Momentum
The report emphasizes that staying above $69,000 is considered crucial to maintain momentum. If the level turns into support, BTC could potentially test the $73,000-$75,000 area.
Conversely, if it fails to hold above $69,000, the price risks returning to the $66,000-$67,000 consolidation area. At an exchange rate of 1 USD = IDR16,919, this level range is equivalent to around IDR1.12 billion to IDR1.27 billion.
For those of you who want to read the crypto market practically, the point is to combine ETF data (fund flows and cost basis) with short-term technical levels to assess whether the rally has structural support.
Also Read: 700% Crypto Withdrawal Surge in Iran: Bitcoin becomes a financial escape route during crisis
Follow us on Google News to stay up to date with the latest in crypto and blockchain technology. Check Bitcoin price, usdt to idr and tokenized nvidia stock price through Pintu Market.
Enjoy an easy and secure crypto trading and crypto gold investment experience by downloading the Pintu crypto app via Play Store or App Store now. Also, experience web trading with advanced trading tools such as pro charting, various order types, and portfolio tracker only at Pintu Pro.
*Disclaimer
This content aims to enrich readers’ information. Pintu collects this information from various relevant sources and is not influenced by outside parties. Note that an asset’s past performance does not determine its projected future performance. Trading crypto carries high risk and volatility, always do your own research and use cold hard cash beforeinvesting. All activities of buying and selling Bitcoin (BTC) and other crypto asset investments are the responsibility of the reader.
Reference
- Sebastian Villafuerte/NewsBTC. The $11,000 Deficit: Why the Record $8.9B Bitcoin ETF Drawdown Is Paralyzing Wall Street’s BTC Appetite. Accessed March 6, 2026.
Latest News
© 2026 PT Pintu Kemana Saja. All Rights Reserved.
The trading of crypto assets is carried out by PT Pintu Kemana Saja, a licensed and regulated Digital Financial Asset Trader supervised by the Financial Services Authority (OJK), and a member of PT Central Finansial X (CFX) and PT Kliring Komoditi Indonesia (KKI). Crypto asset trading is a high-risk activity. PT Pintu Kemana Saja do not provide any investment and/or crypto asset product recommendations. Users are responsible for thoroughly understanding all aspects related to crypto asset trading (including associated risks) and the use of the application. All decisions related to crypto asset and/or crypto asset futures contract trading are made independently by the user.