Bitcoin Hits $67,000 Today as Whales and Long-Term Holders Continue to Accumulate BTC
Jakarta, Pintu News – Bitcoin (BTC) is approaching a crucial decisive zone. An analyst warned that the market should not miss the $63,000 area-more precisely $63,700-as a break below this level could trigger a deeper decline.
However, at the same time, the daily chart (3/8) is slowly forming a cup-and-handle pattern that is bullish and indicates a potential rally towards $88,000. When a positive technical structure meets an increased level of risk, the next move has the opportunity to determine the direction of Bitcoin’s short-term trend.
Then, how will the Bitcoin price move today?
Bitcoin Price Up 0.25% in 24 Hours
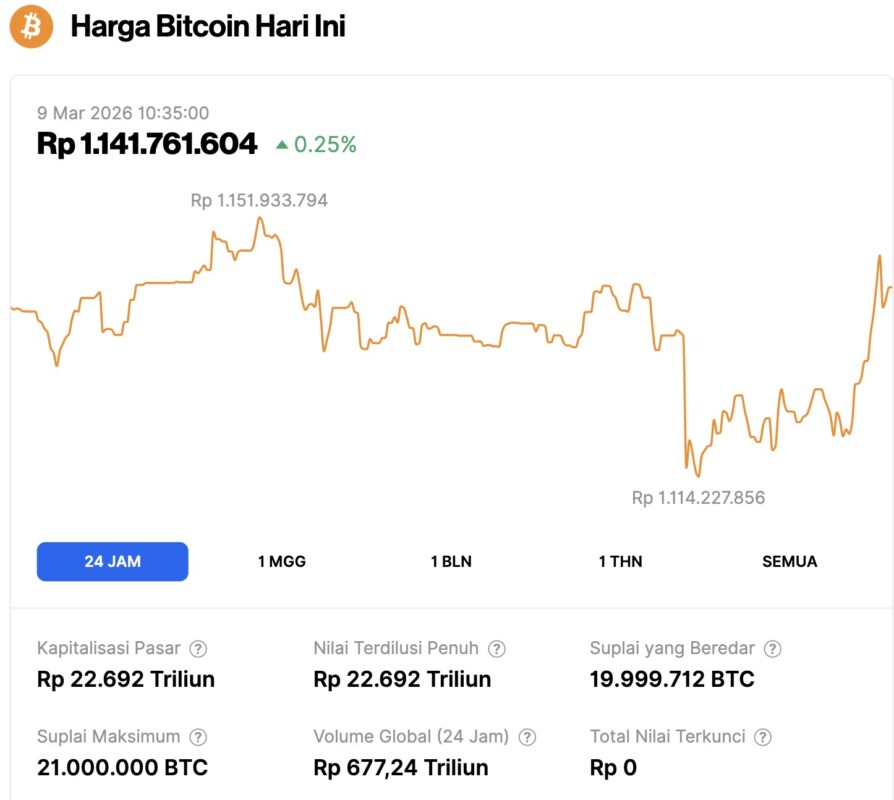
On March 9, 2026, Bitcoin was trading at $67,249, or about IDR 1,141,761,604, marking a 0.25% gain over the past 24 hours. Within that window, BTC dipped to a low of IDR 1,114,227,856 and climbed to a high of IDR 1,151,933,794.
At the time of writing, Bitcoin’s market capitalization is approximately IDR 22,692 trillion, while 24-hour trading volume has surged 56% to IDR 677.24 trillion.
Read also: 3 Altcoins Threatened with Major Liquidation in Early March, Prepare for Extreme Volatility!
Analysts Highlight $63,700 Risk Despite Bullish Setup Starting to Form
This warning comes from Alphractal founder Joao Wedson, who recently emphasized $63,700 as a crucial on-chain structural level for Bitcoin. In his analysis, he stated that the loss of the level could trigger a broader redistribution phase in the market.
If that level is broken, Wedson identifies several potential areas of decline, with $57,000 and $52,400 being the closest zones. He also added that these levels adjust daily following investor activity on the blockchain, so those dynamic thresholds may shift slightly over time.
However, the current Bitcoin price chart shows a different narrative.
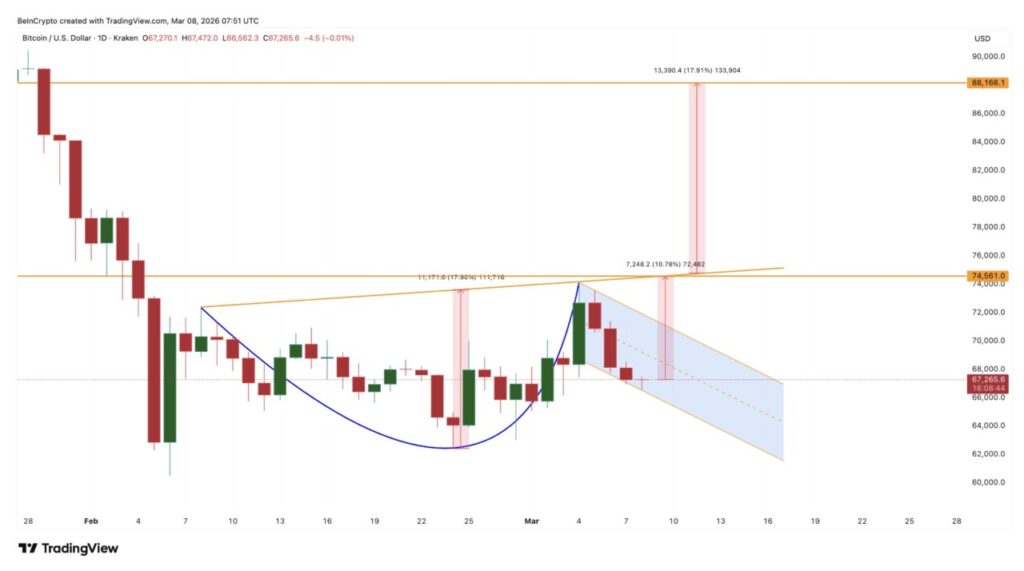
On the daily timeframe, Bitcoin appears to be forming a cup-and-handle pattern that started developing around February 8 and completed the “cup” phase near March 4. Currently, the market is consolidating at the “handle” part of the pattern.
If Bitcoin is able to break the neckline around $74,500, the projection of this pattern points to a potential rally of around 18% towards the $88,100 area.
This situation creates an important contradiction: the bullish breakout target is more than 10% above the current price, while the critical support level highlighted by analysts is just a few levels below it.
Thus, although the chart structure looks constructive, closer risk levels can be decisive for the direction of the next market movement. To get a more in-depth picture, the next analysis needs to turn to on-chain data.
Whale and Mid-term Holder Continue to Accumulate
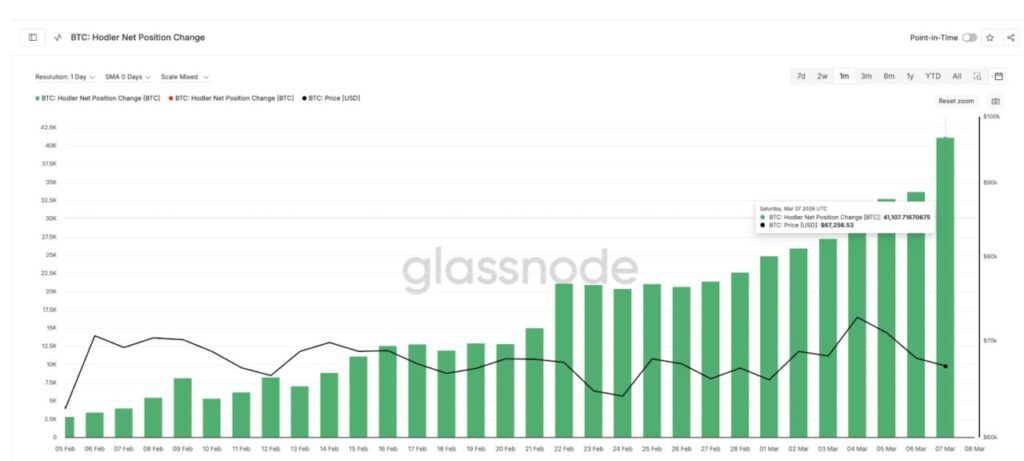
On-chain activity is currently trending bullish. One of the strongest signals is seen in Bitcoin’s Holder Net Position Change metric, which measures accumulation by wallets holding coins for 155 days or more. When this metric increases, it generally indicates that investors prefer to hold the asset rather than sell it.
Since February 8, when the cup pattern began to develop, this metric has jumped sharply. The 30-day net position change rose from around 5,434 BTC to over 41,107 BTC on March 7. This means that there was an increase of about 650% during the pattern’s formation phase.
Read also: How Whales Bought and Unloaded Crypto During the U.S.–Iran Conflict?
This spike suggests that medium to long-term holders are accumulating amidst Bitcoin’s consolidation phase, thus reinforcing the idea that the market is preparing for a potential breakout, or at least a rebound.
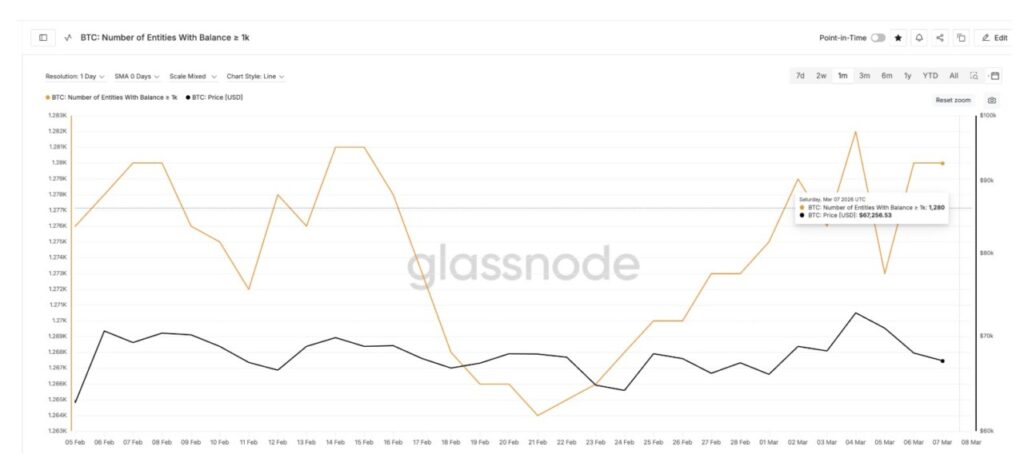
Whale behavior is also in line with this view. The number of Bitcoin entities holding at least 1,000 BTC has increased gradually since February 21. In that period, the number rose from 1,264 addresses to around 1,280, close to the highest level recorded on a monthly basis.
Despite a short-term correction on March 4-5 (when the number of whale addresses dropped slightly), the overall upward trend continued.
Combined, these two metrics indicate that large investors and more “committed” holders are gradually adding exposure, in line with bullish chart patterns. However, not all long-term holder groups share the same optimism.
Some Long-Term Bitcoin Holders Quietly Reduce Exposure
While whales and medium-term holders continue to accumulate, there is another group that appears to be moving in the opposite direction.
Data from Bitcoin HODL Waves, which tracks how long coins have been dormant, shows that the share of holders with a holding age of 3-5 years has decreased.
This group controlled about 11.49% of Bitcoin’s circulating supply on February 5. However, on March 7, the portion dropped to approximately 10.94%.
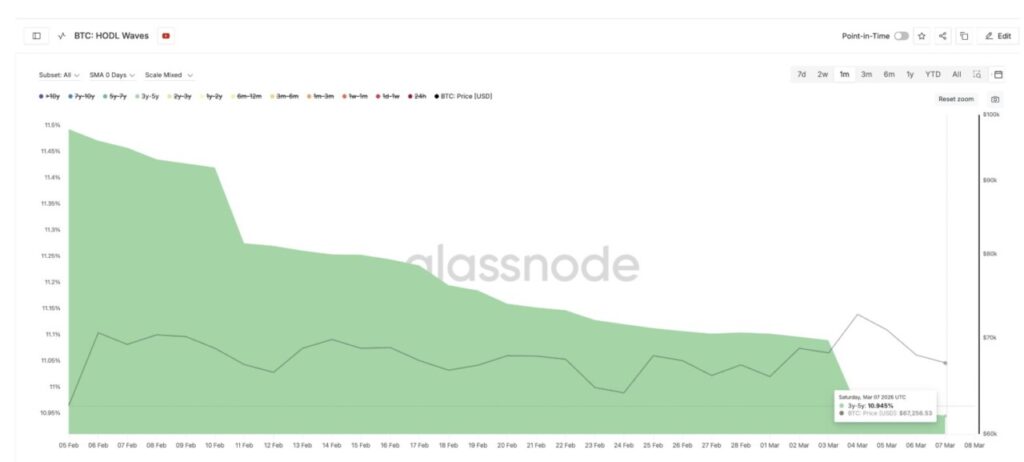
While the percentage change may seem small, the impact is significant when applied to the limited supply of Bitcoin. A decrease in this group indicates that some older coins are returning to circulation, suggesting that some long-term holders may be starting to distribute.
This creates an unusual dynamic. As whales and medium-term holders increase accumulation, longer holders appear less compelled to increase exposure, creating subtle supply pressure.
This directional divergence makes the key support levels highlighted by Wedson even more relevant.
Why the $63,000 Level Could Determine Bitcoin’s Next Price Movement
A broader Fibonacci retracement analysis-from the late January drop to the March rally-also confirms the on-chain levels that Wedson previously highlighted. Such levels may not be immediately apparent as the cup structure is bullish. However, the context becomes clearer when including BTC’s roughly 33% drop from January 28 to February 6.
A reading of the chart reveals a support zone around $63,300. This area aligns with the $63,700 level emphasized by Alphractal’s analysis, given that the on-chain threshold is dynamic and can shift.
If that support fails to hold, the next Fibonacci levels are around $56,700 (in line with Wedson’s $57,000 level) and $52,000 (near the $52,400 zone), consistent with the downside areas mentioned in the analyst alert.
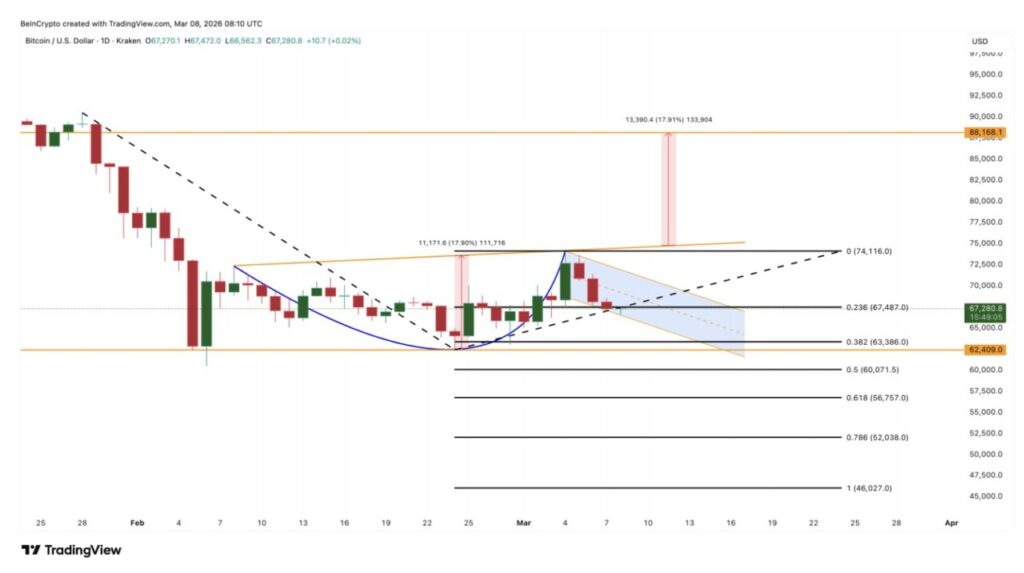
In other words, the on-chain analysis and the broader technical structure both converge at similar critical regions. For Bitcoin to regain strong bullish momentum, the market needs to reclaim the neckline area around $74,100. This move has the potential to confirm the breakout of the cup-and-handle pattern and open up room for an upside towards the $88,100 target.
Until then, Bitcoin price is still in a tug-of-war between whale accumulation, the caution of some long-term holders, and a relatively fragile support zone.
Whether the $63,000 support area holds or is broken will likely determine whether the next move is a rally to higher levels, or a deeper correction first.
Follow us on Google News to stay up to date with the latest in crypto and blockchain technology. Check Bitcoin price, usdt to idr and tokenized nvidia stock price through Pintu Market.
Enjoy an easy and secure crypto trading and crypto gold investment experience by downloading the Pintu crypto app via Play Store or App Store now. Also, experience web trading with advanced trading tools such as pro charting, various order types, and portfolio tracker only at Pintu Pro.
*Disclaimer
This content aims to enrich readers’ information. Pintu collects this information from various relevant sources and is not influenced by outside parties. Note that an asset’s past performance does not determine its projected future performance. Crypto trading activities are subject to high risk and volatility, always do your own research and use cold hard cash before investing. All activities of buying and selling Bitcoin and other crypto asset investments are the responsibility of the reader.
Reference:
- BeInCrypto. Bitcoin Price at $63K: Risk of Drop vs. $88K Breakout – Analysis. Accessed on March 9, 2026
Latest News
© 2026 PT Pintu Kemana Saja. All Rights Reserved.
The trading of crypto assets is carried out by PT Pintu Kemana Saja, a licensed and regulated Digital Financial Asset Trader supervised by the Financial Services Authority (OJK), and a member of PT Central Finansial X (CFX) and PT Kliring Komoditi Indonesia (KKI). Crypto asset trading is a high-risk activity. PT Pintu Kemana Saja do not provide any investment and/or crypto asset product recommendations. Users are responsible for thoroughly understanding all aspects related to crypto asset trading (including associated risks) and the use of the application. All decisions related to crypto asset and/or crypto asset futures contract trading are made independently by the user.