XRP ready to explode in March 2026? Here are the signals!
Jakarta, Pintu News – An interesting phenomenon is occurring in the price movement of Ripple (XRP) in early March 2024. The Bollinger Bands technical indicator shows a squeeze pattern signaling very low volatility, a condition that often signals the beginning of major price movements.
The situation is all the more interesting as it coincides with the upcoming release of US inflation data (CPI) and the Federal Open Market Committee (FOMC) decision. Market participants are now waiting to see whether XRP will experience a price surge or a sharp correction in the near future.
Squeeze Bollinger Bands: A Signal of Calm Before the Storm
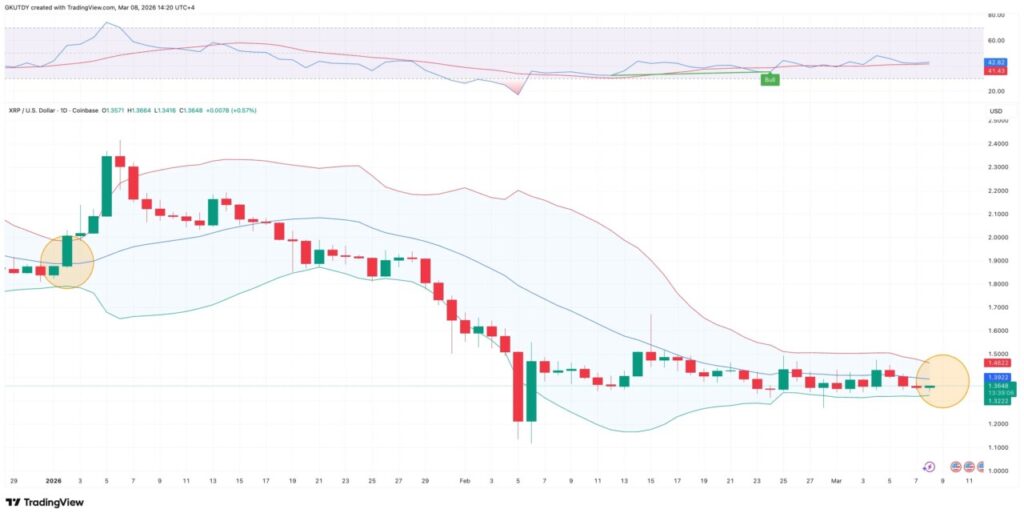
Bollinger Bands is an indicator used to measure the price volatility of an asset, including Ripple (XRP). When the upper and lower boundaries of the Bollinger Bands approach each other, as seen on the current TradingView chart, it signals very low volatility. This condition is often referred to as a squeeze, where the price moves in a narrow range and waits for a trigger to break out of the zone.
In the history of price movements, squeeze periods are usually followed by significant spikes in volatility. On the daily chart of Ripple (XRP), the price is currently stuck in the range of $1.32 to $1.46, showing a very tight consolidation pattern. This situation is reminiscent of the events in January 2024, where a similar squeeze triggered a price increase of over 25%. However, it is important to note that the breakout from the squeeze can occur in either direction, up or down. The price position around the centerline of the Bollinger Bands adds to the uncertainty of the direction of the next move.
Also Read: Crazy Prediction! Bitcoin could reach Rp2.02 billion in March 2026, ETH to Rp202 million?
The Role of CPI and FOMC: New Volatility Triggers for XRP
Interestingly, this time the Bollinger Bands squeeze occurred ahead of two important macroeconomic agendas, namely the Consumer Price Index (CPI) data release on March 11 and the FOMC decision on March 17-18, 2024. These two events have the potential to be major catalysts that could trigger a spike in volatility in the crypto market, including Ripple (XRP).
Inflation data and interest rate policy from the United States are often the determining factors for the direction of digital asset movements globally. If the CPI results and FOMC decision provide positive sentiment, it is possible that the price of Ripple (XRP) will break the upper limit of the Bollinger Bands and continue the rally to the $1.60 area or higher.
Conversely, if market sentiment deteriorates, prices could correct to the support zone in the range of $1.10 to $1.20. Therefore, investors and traders need to pay close attention to macroeconomic news developments as part of their decision-making strategy. A combination of technical and fundamental analysis is key in this crucial period.
RSI Indicator and Breakout Potential: Volume Spike Ready
In addition to the Bollinger Bands, the Relative Strength Index (RSI) indicator also provides an interesting picture of the current condition of Ripple (XRP). RSI is in the neutral zone, indicating that this asset has not experienced overbought or oversold conditions. Thus, there is room for price movement in both directions, either up or down, depending on the triggers that appear in the near future.
The squeeze condition that occurs is usually followed by a sudden spike in trading volume. If the breakout occurs to the upside, the next price target is in the $1.60 area and potentially higher if the positive momentum continues. However, if selling pressure dominates, Ripple (XRP) is likely to test strong support in the range of $1.10 to $1.20. Market participants are expected to remain vigilant and pay attention to technical signals and global news developments to anticipate extreme price movements.
Conclusion
The Bollinger Bands squeeze phenomenon that occurred on Ripple (XRP) in early March 2024 is a major concern for crypto market participants. With important events such as the CPI release and the FOMC decision, the potential for a spike in volatility is even greater. Both investors and traders need to prepare a well-thought-out strategy to deal with possible price breakouts in the near future. A combination of technical and fundamental analysis will be key in determining the best move amidst the current market uncertainty.
Also Read: 5 Big Crypto Issues of March 2026: FOMC, Stablecoins, to Unlock Billion Worth Tokens
Follow us on Google News to stay up to date with the latest in crypto and blockchain technology. Check Bitcoin price, usdt to idr and tokenized nvidia stock price through Pintu Market.
Enjoy an easy and secure crypto trading and crypto gold investment experience by downloading the Pintu crypto app via Play Store or App Store now. Also, experience web trading with advanced trading tools such as pro charting, various order types, and portfolio tracker only at Pintu Pro.
*Disclaimer
This content aims to enrich readers’ information. Pintu collects this information from various relevant sources and is not influenced by outside parties. Note that an asset’s past performance does not determine its projected future performance. Trading crypto carries high risk and volatility, always do your own research and use cold hard cash beforeinvesting. All activities of buying and selling Bitcoin (BTC) and other crypto asset investments are the responsibility of the reader.
Reference
- U.Today. XRP Bollinger Bands Reach Critical Squeeze: Calm Before the Storm?. Accessed on March 9, 2026
Latest News
© 2026 PT Pintu Kemana Saja. All Rights Reserved.
The trading of crypto assets is carried out by PT Pintu Kemana Saja, a licensed and regulated Digital Financial Asset Trader supervised by the Financial Services Authority (OJK), and a member of PT Central Finansial X (CFX) and PT Kliring Komoditi Indonesia (KKI). Crypto asset trading is a high-risk activity. PT Pintu Kemana Saja do not provide any investment and/or crypto asset product recommendations. Users are responsible for thoroughly understanding all aspects related to crypto asset trading (including associated risks) and the use of the application. All decisions related to crypto asset and/or crypto asset futures contract trading are made independently by the user.