Bitcoin Price Holds at $69,000 Today: Strong Signals Suggest BTC is Forming a Base Below $60K
Jakarta, Pintu News – The price of Bitcoin (BTC) has experienced sharp fluctuations between around $70,000 and $60,000 in recent weeks, leaving traders in confusion as to the next big move.
The views of the BeInCrypto page Expert Council, which includes names connected to Standard Chartered and Kraken, suggest that the market may be entering a phase of stabilization, rather than further collapse.
Although the latest cycle low is around 60,000, on-chain data and market structure suggest that a potential bottom could be forming around this region, although a deeper drop is still possible if some key signals fail to improve.
Then, how will the Bitcoin price move today?
Bitcoin Price Drops 0.36% in 24 Hours
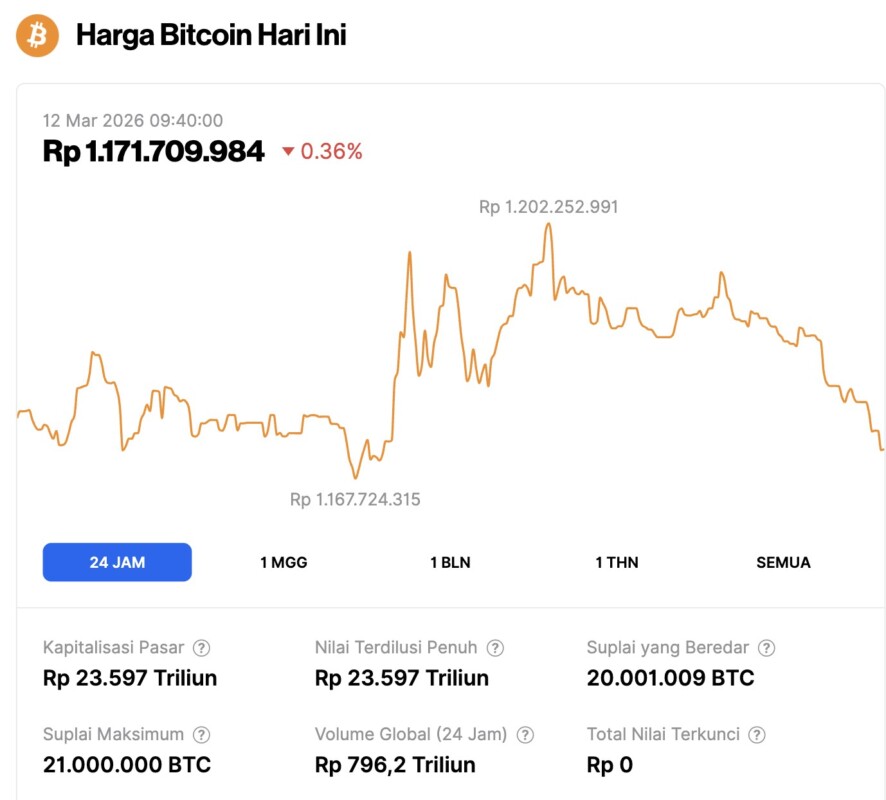
On March 12, 2026, Bitcoin was priced at $69,460, equivalent to IDR 1,171,709,984, reflecting a 0.36% correction in the last 24 hours. During this period, BTC reached a low of IDR 1,167,724,315 and a high of IDR 1,202,252,991.
At the time of writing, Bitcoin’s market capitalization is approximately IDR 23,597 trillion, with a 15% decrease in trading volume over the last 24 hours, now totaling IDR 796.2 trillion.
Read also: Hyperliquid (HYPE) Price Could Reach $150 by 2026? Check out Arthur Hayes’ Analysis!
Reduced Volatility and Deleveraging Suggest Market Stress is Easing
One of the first clues analysts look for when a market begins to stabilize is a decrease in volatility. When volatility begins to decline, it often signals that selling pressure is beginning to subside and the market may be starting to form a bottom.
Bitcoin’s annualized volatility reached around 93.2% in June 2022, during the peak of one of the previous bear markets.
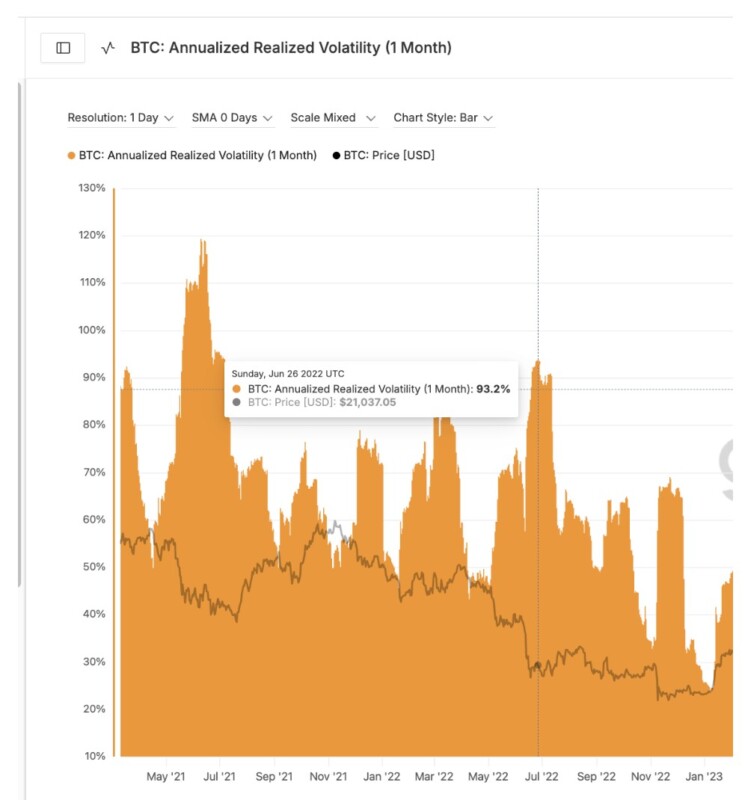
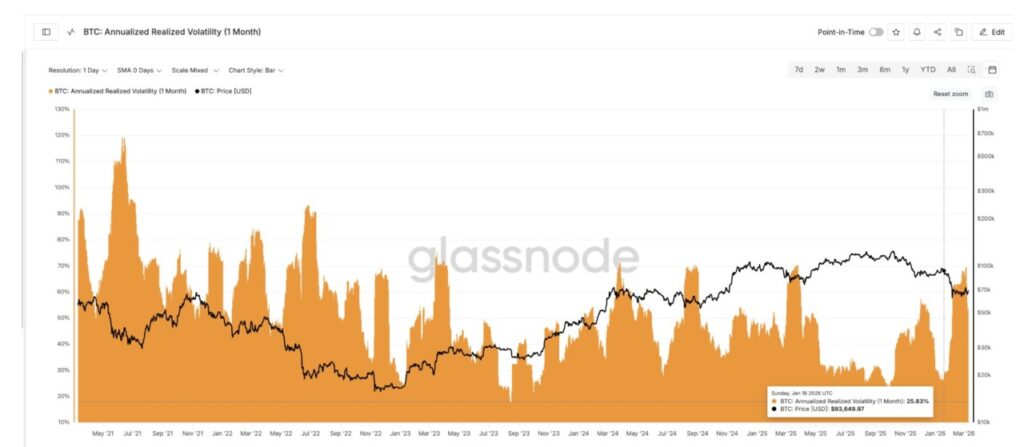
In contrast, volatility fell to 25.8% in mid-January 2026. Although volatility has since climbed back up to the 60% range, the previous compression suggests that extreme panic conditions have largely subsided, compared to a more aggressive bear market scenario.
Michael Walsh, chairman of Standard Chartered subsidiary and Kraken entity, recently highlighted this dynamic.
“The volatility recorded is really below average when compared to the position in the last four years.”
Moreover, even if we track historical ‘Notable Volatility’ data (first image), we see that this metric declines as the bear market bottom strengthens. The same can be said for now.
Another signal of improving market conditions is the decline in derivatives leverage.
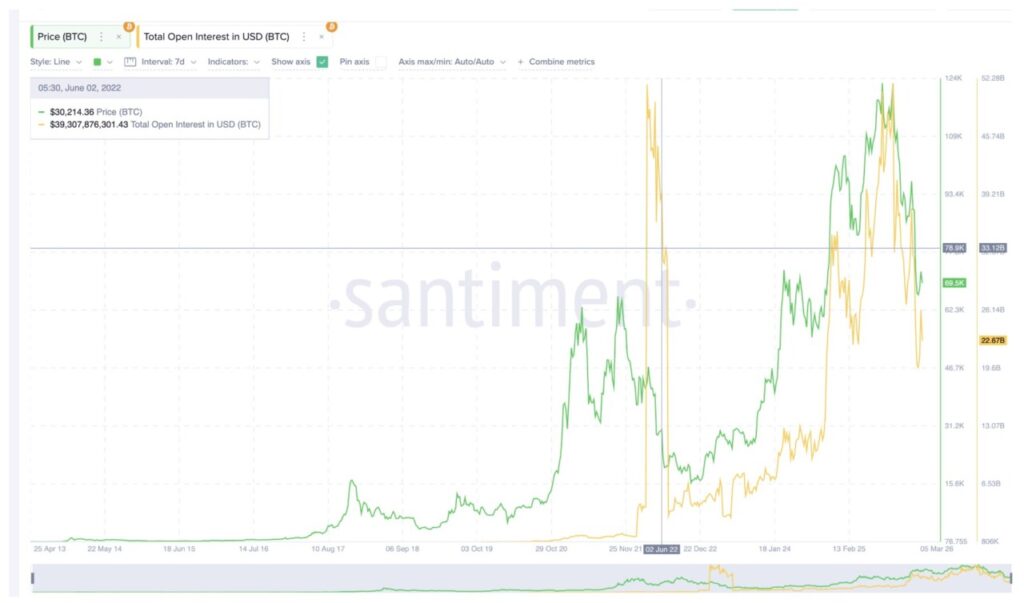
During the base formation phase of the market in 2022, Bitcoin derivatives open interest reached around $33 billion. Currently, it stands at around $22.6 billion. This decrease in leverage, not only relative to recent levels, becomes even more pronounced when comparing exchange leverage ratios.
According to CryptoQuant, the estimated Bitcoin leverage ratio on Binance has dropped from 0.198 to 0.152 since February, which represents a sharp decline in speculative positions.
This kind of leverage reset usually occurs when liquidation forces leveraged traders out of the market. While this process can be painful in the short term, it often stabilizes prices by removing excessive speculation.
Overall, the decline in volatility and falling leverage suggest that the market may be transitioning from panic conditions to a stabilization or base-building phase.
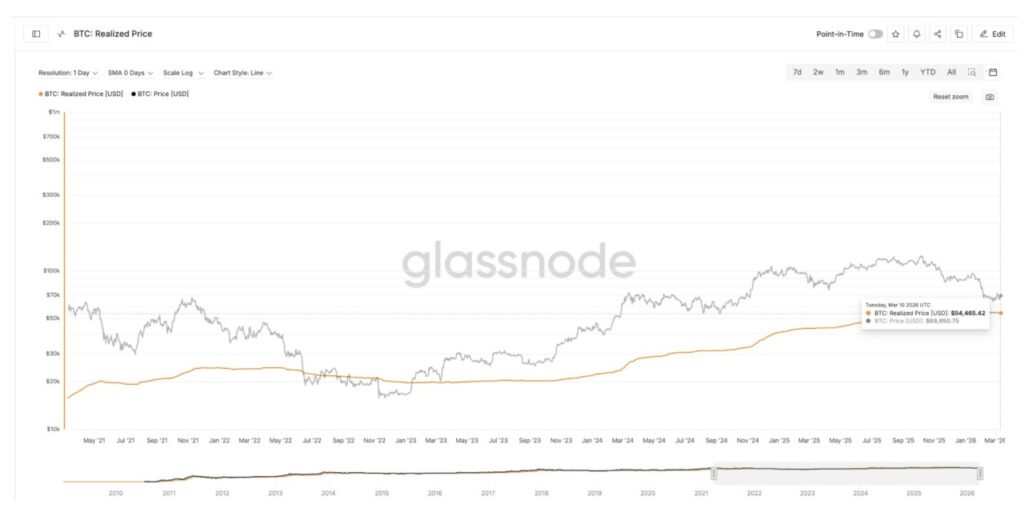
Realized Price Reveals Potential Structural Support
Another important metric that analysts look at when looking for a market floor is Bitcoin’s realized price. The realized price represents the average price at which all Bitcoins in circulation were last moved on the blockchain. In simple terms, this metric estimates the average cost of the entire network.
Bitcoin’s realized price is currently hovering around 55,000 ($54,465 to be exact). Historically, when Bitcoin drops towards this level, the market often starts to attract buyers as many investors approach their average entry price.
As a result, realized prices often serve as long-term equilibrium levels where demand begins to return. If the current $60,000 psychological support zone breaks, the region between $55,000 and $50,000 could be the next area where structural demand emerges.
Read also: Pi Network Price Prediction: Pi Coin’s latest rise hampered by profit-taking, how come?
However, realized prices alone do not determine the market bottom. Investor behavior, especially among long-term holders, provides another important signal.
Long-term Holder Behavior Indicates Accumulation Is Just Beginning
Long-term holders are conviction-driven investors and typically hold their Bitcoin for more than 365 days (instead of just 155 days like standard holders).
One of the key metrics used to track this activity is the indicator of change in net position of long-term holders. This metric shows whether long-term investors are increasing or decreasing their Bitcoin holdings.
Over the past three months, this indicator has remained mostly negative, which means long-term holders are still distributing coins during the correction.
However, recently, small green spikes have started to appear. This indicates that long-term holders are starting to accumulate again slowly. While this is an encouraging signal, the scale of accumulation is still relatively small compared to previous cycles.
Accumulation Before Strong Relay
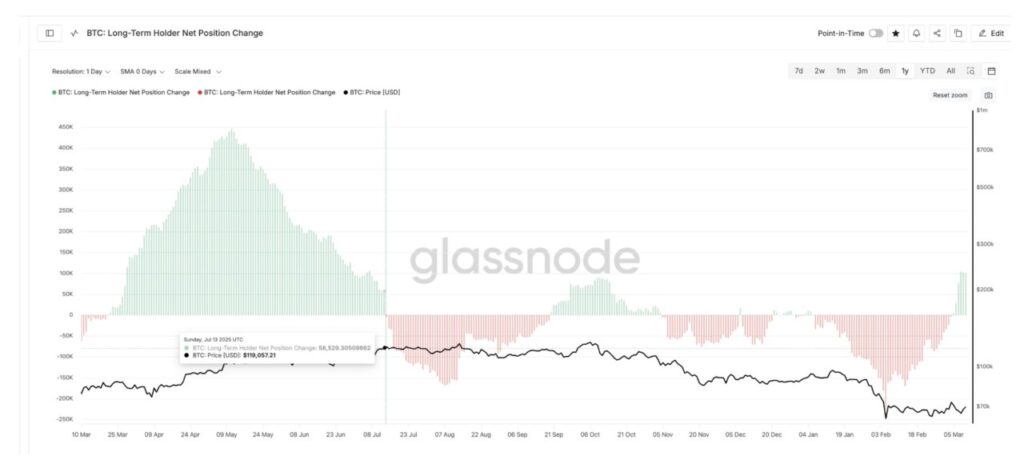
Historically, strong rallies tend to start only after a sustained accumulation phase from long-term holders. One such example occurred between May and July 2025, when strong accumulation preceded Bitcoin’s explosive rally that year.
This is in line with the main conclusions in the BeInCrypto page Expert Council discussion, where Geoff Kendrick, Head of Global Digital Asset Research at Standard Chartered, and Michael Walsh mentioned the gradual return of investor confidence as one of the basic scenarios for the formation of a BTC base.
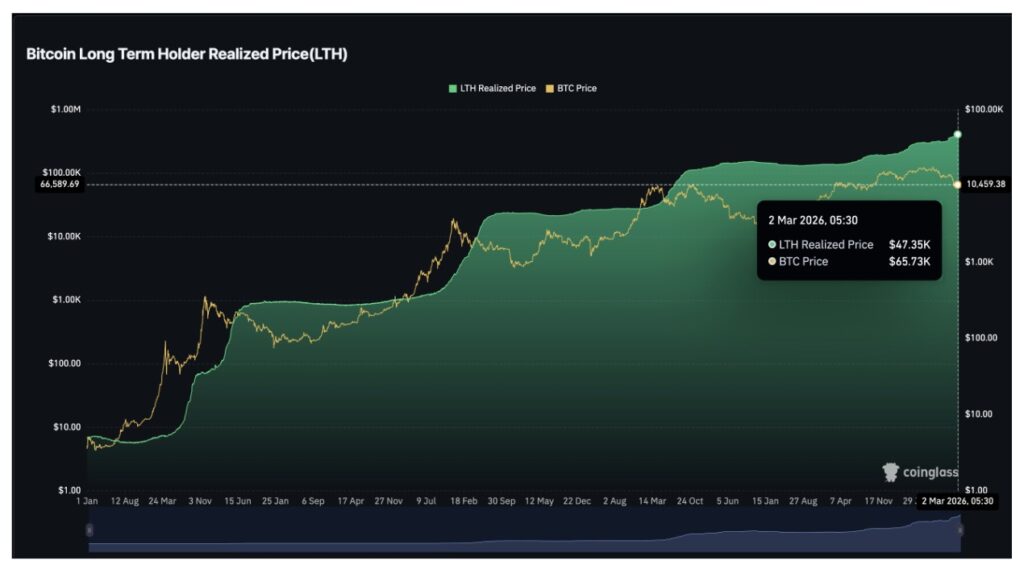
Another metric that helps identify the price level at which long-term investors typically begin to defend the market is the long-term holder realized price, which estimates the average cost specifically for coins held by long-term investors. Currently, this level stands at around $47,000.
As Bitcoin approaches this region, long-term holders have historically started to accumulate aggressively, as the price approaches their average buying level.
Interestingly, the previous leverage reset may also help explain why accumulation is slowly returning. As derivatives leverage decreases and volatility compresses, the market becomes less dominated by speculative traders and more attractive to long-term investors looking to rebuild their positions.
ETF Flows and Sentiment Will Determine Whether a True Base Will Form
Institutional demand may ultimately determine whether Bitcoin forms a bottom or continues to decline, as highlighted in the Expert Council discussion. One of the most obvious ways to track institutional activity is through spot Bitcoin ETF flows.
ETF flows show clear patterns around previous market turning points.
Prior to the establishment of the market floor in April 2025, Bitcoin experienced significant ETF outflows in February and March. However, inflows started back in April and continued for several months, helping to confirm the recovery. The current cycle shows a similar pattern.
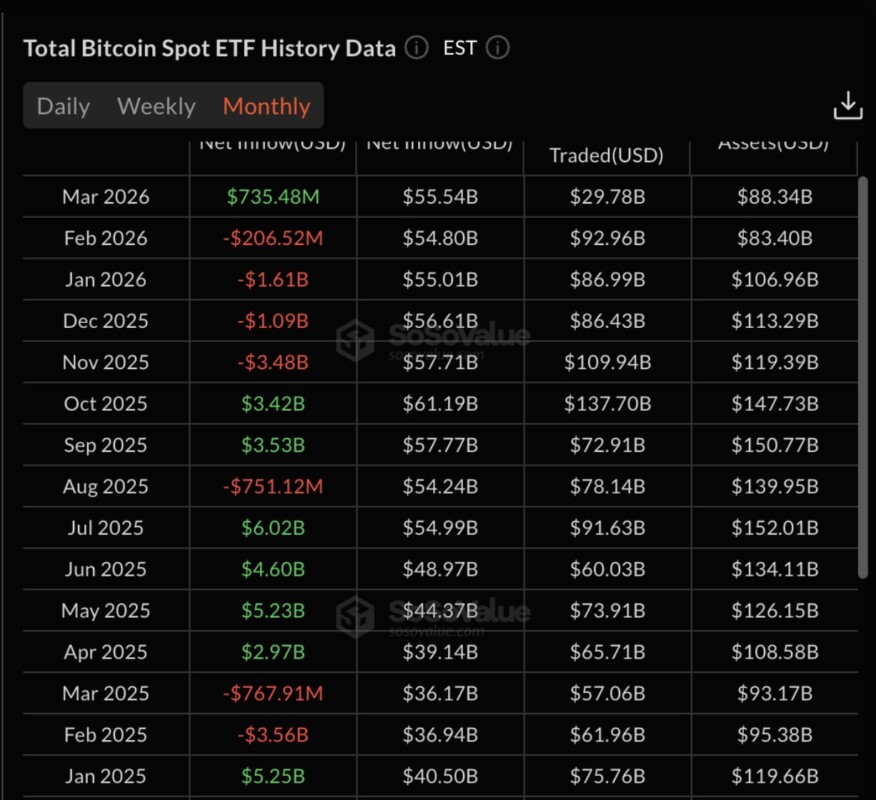
Bitcoin ETFs experienced four consecutive months with outflows from November 2025 to February 2026. These continued outflows reflect weakening institutional demand during the correction.
However, March has already recorded about $735 million in inflows, which suggests that institutional investors may be starting to return to the market slowly. If the inflows continue until the end of the month, it could signal that the market is entering the early stages of base formation.
Investor Sentiment Indicator
Investor sentiment metrics provide additional insights. One widely used metric is Net Unrealized Profit/Loss (NUPL). This indicator measures the total unrealized profits across the Bitcoin network.
When NUPL is high, most investors are making paper profits. When the NUPL becomes negative, the market enters a phase of capitulation as most holders incur losses. Bitcoin’s NUPL is currently at around 0.22, which puts the market in what analysts call the hope-fear zone.
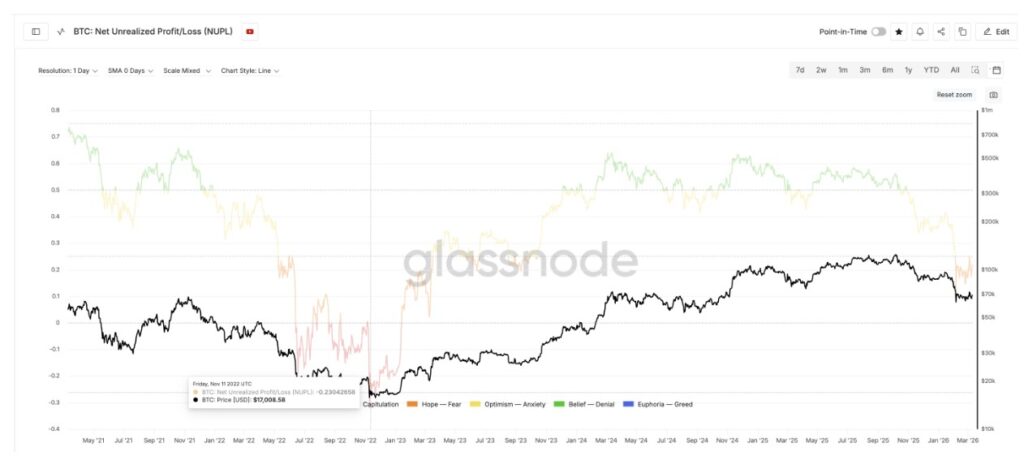
This means investors are still holding moderate unrealized gains, far from the deep capitulation levels seen during the 2022 bear market (a timeline previously used as a reference), when NUPL fell below -0.23. Interestingly, the 2025 market bottom formed without deep capitulation, as the NUPL remained around 0.42 before the rally began.
If ETF inflows continue to improve, Bitcoin may be able to form a bottom within the current sentiment zone, rather than entering a full capitulation phase.
Bitcoin Price Structure Highlights Critical Levels to Watch Out For
While on-chain metrics provide context, the price chart ultimately defines the key levels that investors should watch.
On the 3-day chart, Bitcoin recently completed a death cross, a technical signal that occurs when the 50-period exponential moving average (EMA) drops below the 200-period EMA, a trend-tracking indicator that gives more weight to recent prices.
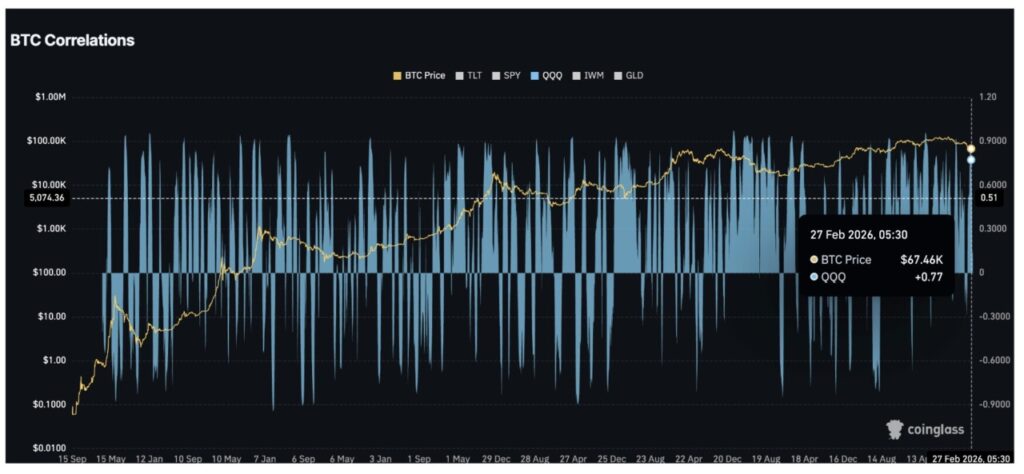
This EMA-led weakness coincides with Bitcoin’s increasingly strong correlation with tech stocks. This correlation is also highlighted by our experts.
Bitcoin’s relationship with the Invesco QQQ Trust (QQQX), which tracks the NASDAQ-100 and serves as a proxy for large tech stocks, recently reached 0.77 at the end of February.
This suggests that Bitcoin is still trading as a risky asset alongside growth stocks. If tech stocks weaken due to macro pressures or geopolitical tensions, Bitcoin could face similar short-term headwinds.
Using technical levels to chart BTC’s January peak around $98,000 to February’s low around $60,000 and bounce to $73,900, some key price levels are now emerging.
The first major resistance lies around $73,900. A confirmed three-day close above this zone would strengthen the recovery narrative and signal that bullish momentum is starting to return.
On the downside, the $60,000-$59,500 zone remains the most critical support region. If this support fails, the next big level appears around $55,000, which is very close to Bitcoin’s realized price.
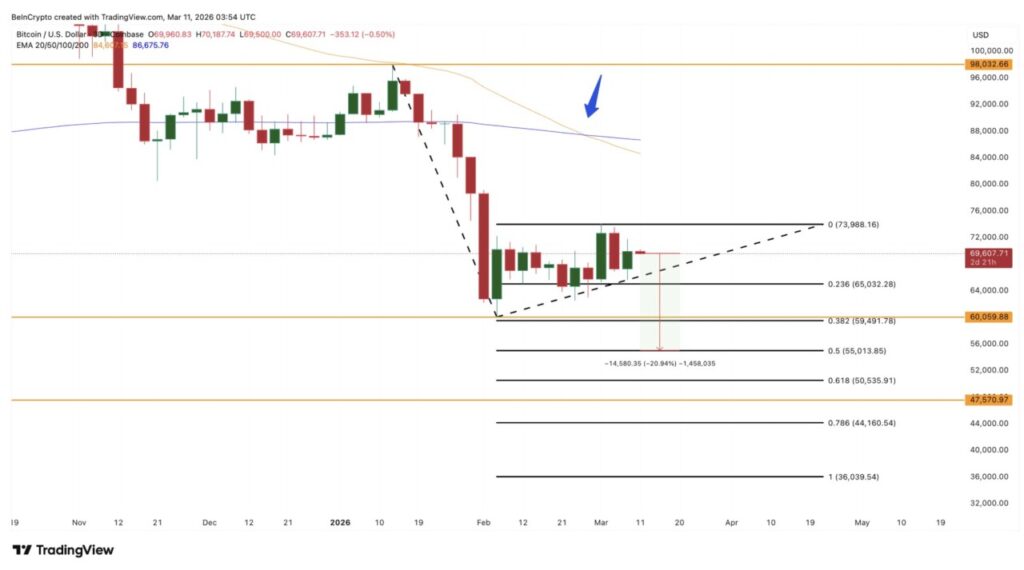
A deeper drop could push the price of BTC towards the $44,000 to $50,000 range, where the realized price of long-term holders resides.
Advice from Geoff Kendrick
Geoff Kendrick of Standard Chartered previously highlighted a similar possibility, but with a bullish viewpoint:
“I think investors want to start buying on those dips. I would say any dip below $60K is good. Maybe we get to $50K… I could see it going back to $100K by the end of the year,” Geoff Kendrick said.
Bitcoin’s current market structure suggests that the asset may be entering a transitional phase rather than a full capitulation cycle.
However, resistance around $74,000 still needs to be broken. Until that happens, the possibility of another drop towards the $55,000-$50,000 zone remains.
Follow us on Google News to stay up to date with the latest in crypto and blockchain technology. Check Bitcoin price, usdt to idr and tokenized nvidia stock price through Pintu Market.
Enjoy an easy and secure crypto trading and crypto gold investment experience by downloading the Pintu crypto app via Play Store or App Store now. Also, experience web trading with advanced trading tools such as pro charting, various order types, and portfolio tracker only at Pintu Pro.
*Disclaimer
This content aims to enrich readers’ information. Pintu collects this information from various relevant sources and is not influenced by outside parties. Note that an asset’s past performance does not determine its projected future performance. Crypto trading activities are subject to high risk and volatility, always do your own research and use cold hard cash before investing. All activities of buying and selling Bitcoin and other crypto asset investments are the responsibility of the reader.
Reference:
- BeInCrypto. Bitcoin Price Drops Below $60,000: Is a Base Formation Underway? Expert Signals. Accessed on March 12, 2026
Latest News
© 2026 PT Pintu Kemana Saja. All Rights Reserved.
The trading of crypto assets is carried out by PT Pintu Kemana Saja, a licensed and regulated Digital Financial Asset Trader supervised by the Financial Services Authority (OJK), and a member of PT Central Finansial X (CFX) and PT Kliring Komoditi Indonesia (KKI). Crypto asset trading is a high-risk activity. PT Pintu Kemana Saja do not provide any investment and/or crypto asset product recommendations. Users are responsible for thoroughly understanding all aspects related to crypto asset trading (including associated risks) and the use of the application. All decisions related to crypto asset and/or crypto asset futures contract trading are made independently by the user.