Ethereum Climbs to $2,300 as Market Eyes Potential 20% Upside
Jakarta, Pintu News – On Monday (16/3), the price of Ethereum (ETH) briefly traded at around $2,260 after rising around 15% in the last seven days. This rise comes on the heels of a gradual recovery from February’s low, which is now pushing the asset towards a key technical resistance zone.
The bullish price structure on the 12-hour chart suggests that Ethereum may be preparing to record a bigger move. However, a number of on-chain and derivatives indicators still show a combination of positive signals and potential risks that need to be watched.
Then, how will Ethereum price move today?
Ethereum Price Rises 6.96% in 24 Hours
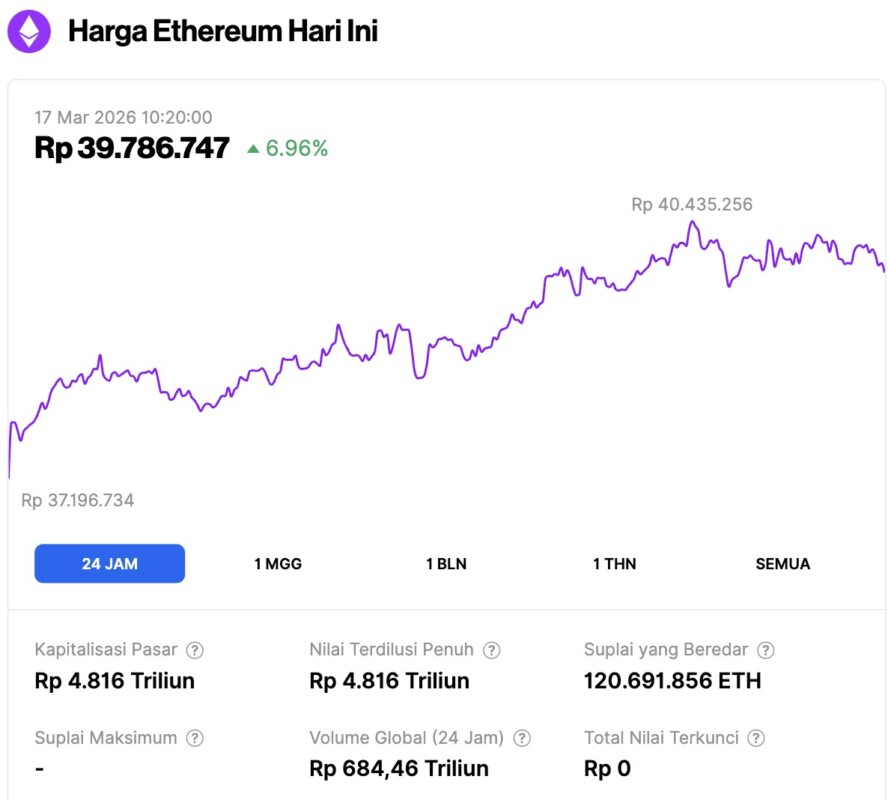
On March 17, 2026, Ethereum was trading at approximately $2,338, or around IDR 39,786,747, marking a 6.96% gain over the past 24 hours. During that same period, ETH fell to a low of IDR 37,196,734 before climbing to an intraday high of IDR 40,435,256.
At the time of writing, Ethereum’s market capitalization stood at roughly IDR 4,816 trillion. Meanwhile, its daily trading volume surged 144% over the last 24 hours to reach IDR 684.46 trillion.
Read also: Bitcoin Price Surges to $75,000 Today: Peter Brandt Sees BTC Bullish Signal!
Ethereum’s Bullish Structure Indicates 20% Upside Potential
The 12-hour chart shows that Ethereum is forming an inverse head and shoulders pattern, a formation that traders often view as a signal of a reversal to a bullish trend.
If the price manages to break and hold above the neckline of the pattern, then the measured movement target leads to a potential increase of around 20%.
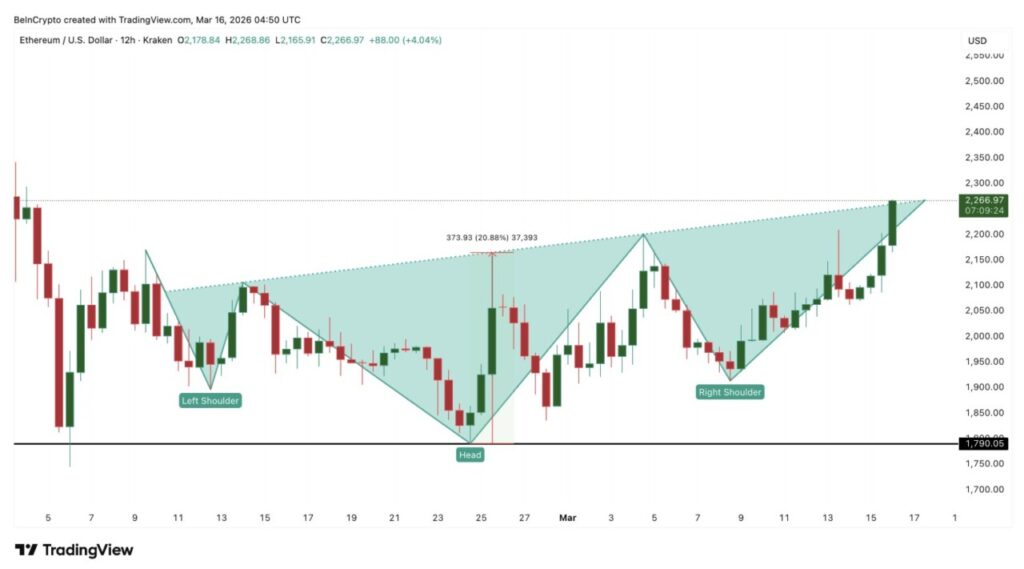
Ethereum itself has moved quite sharply towards the neckline area after bouncing off the right shoulder zone, and currently looks to have surpassed that level. However, breakouts from technical patterns are not always successful. There are times when the movement fails to continue when investors start realizing profits or when too many leveraged traders enter the same position.
Therefore, it is important to assess how holders across the network are currently behaving.
Ethereum Profitability Returns to Positive as Long-Term Holders Continue to Accumulate
One indicator that can be used to read investor sentiment more broadly is Net Unrealized Profit/Loss or NUPL.
NUPL measures whether the average Ethereum holder is in an unrealized state of profit or loss. When this metric flips to the positive area, it means that the average investor is holding ETH in a profitable position. Historically, this can increase the potential for selling pressure as some market participants may choose to secure profits.
Throughout most of February, Ethereum’s NUPL remained in negative territory. On February 5, it had dropped to around -0.21, reflecting a fairly deep capitulation phase when the majority of investors held the coin at a loss.
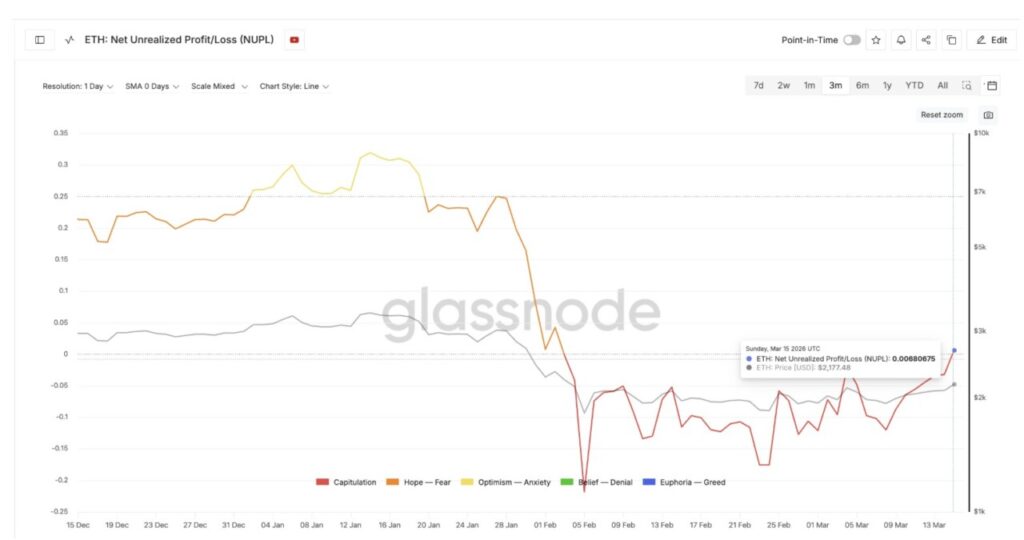
Later, the metric climbed back into positive territory and is now hovering around 0.006, marking the first time it has returned to positive since it was last at similar levels on February 2. This shift suggests that the market is starting to move out of the capitulation phase into the early stages of “hope-fear”, which is the period when profits start to return across the network.
Under normal conditions, the increase in unrealized profits may prompt investors to sell if the rally is not supported by strong market conviction. However, such risks depend largely on whether long-term holders are distributing their assets or continuing to add to their positions.
Long-term holders show confidence through large accumulation
Such behavior can be observed through the Hodler Net Position Change metric. This indicator tracks 30-day rolling changes to the amount of coins held by long-term investors.
On February 24, long-term holders were recorded to add about 9,454 ETH. From then on, the rate of accumulation increased very sharply. By mid-March, the figure had risen to around 523,513 ETH.
Read also: Solana Price Potential Bullish Breakout, Strong Institutional Demand is the Catalyst!
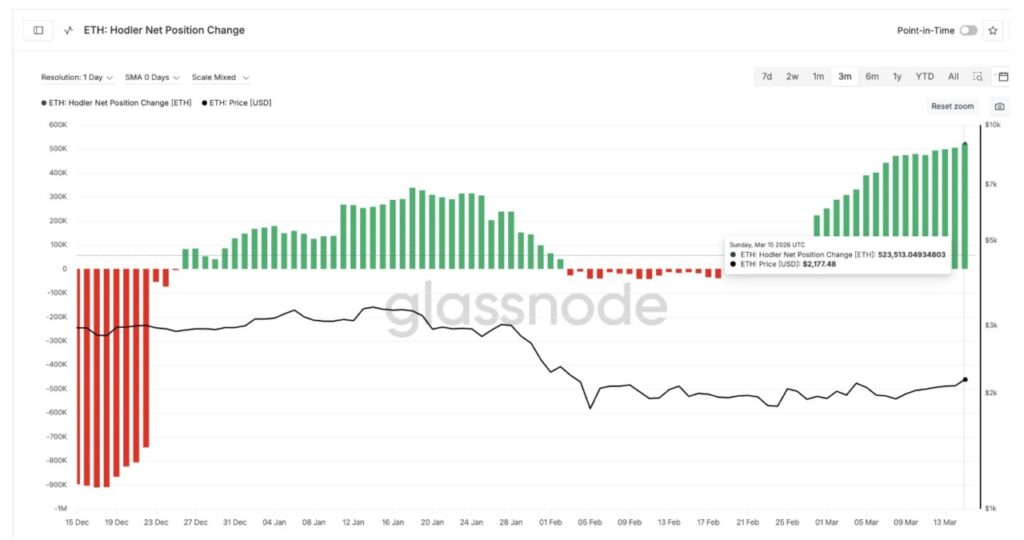
In percentage terms, this reflects a surge in net accumulation of over 5,400%. This huge turnaround suggests that long-term investors regained confidence and chose to add to their holdings during the rally, instead of reducing their exposure. This situation is in contrast to the capitulation phase in early February, when holders turned into net sellers.
When long-term holders continue to accumulate assets at a time when profitability is starting to increase, it is often seen as a signal that investors expect higher prices ahead. However, accumulation in the spot market alone may not be enough to sustain a rally if the derivatives market starts to overheat.
Rising Leverage Adds Risk, While Whale Accumulation Gets Stronger
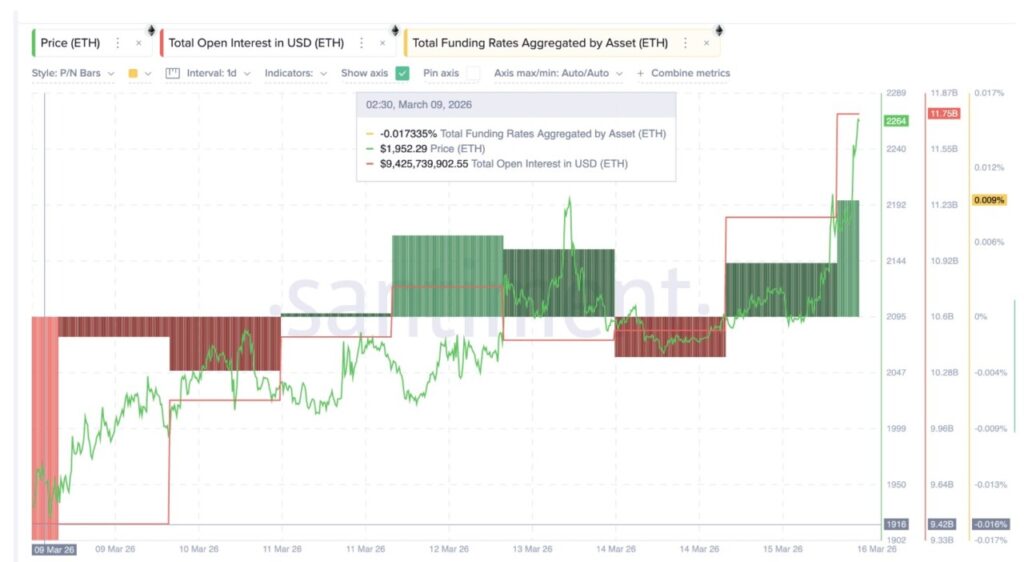
The Ethereum derivatives market shows that the use of leverage is increasing with the latest price movements.
Open interest (OI), which reflects the total value of active futures contracts, rose from around $9.42 billion on March 9 to around $11.75 billion in the latest period. That is, there was an increase of approximately 25%. In addition, the funding rate is now also positive again at 0.009 compared to the beginning of March.
The increase in OI accompanied by a positive funding rate indicates that more traders are opening long positions with leverage. This could increase the risk of a long squeeze if the ETH price corrects, even if only on a limited scale.
At the same time, large Ethereum holders continue to add to their holdings.
On-chain data shows that the wallet whale increased its holdings from approximately 113.46 million ETH on March 12 to approximately 121.47 million ETH in the latest period. This translates to an additional approximately 8.01 million ETH.
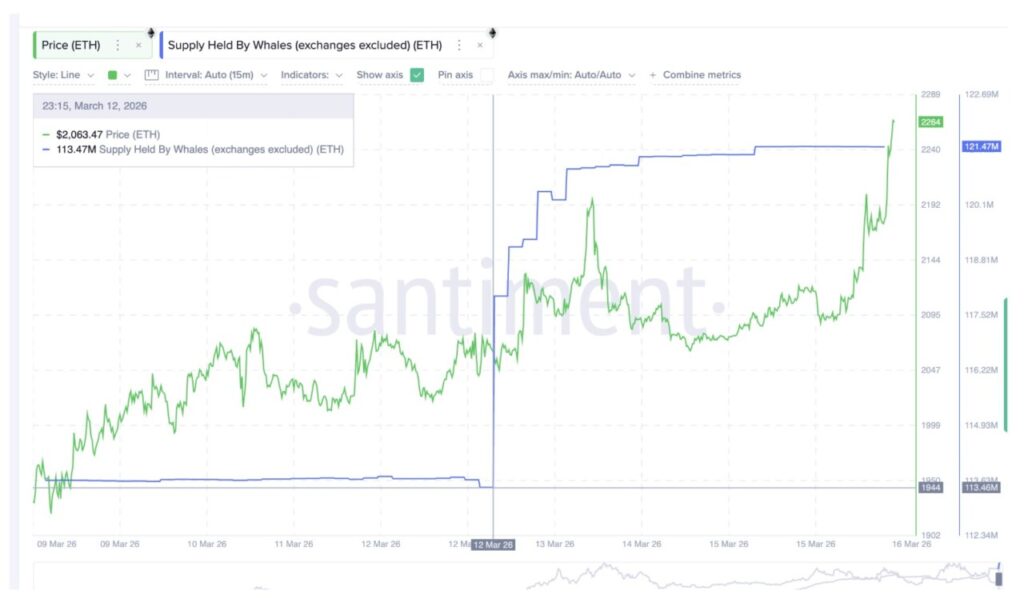
At current prices, the additional supply is equivalent to around $18 billion in Ethereum. However, there are additional nuances to the latest whale activity. One recent large transaction moved 20,000 ETH, worth around $44.9 million, from a regular Coinbase wallet to the Coinbase Prime infrastructure.
Move to Coinbase Prime Doesn’t Change Whale Accumulation Trend
Notably, the whale supply metric used in this analysis measures the amount of assets held by whales by excluding exchange-owned wallets. As such, the data reflects balances on large private wallets, not coins held on trading platforms.
Consequently, the institutional transfer to Coinbase Prime does not directly change the whale supply metric. As such, the accumulation trend seen in this indicator remains reflective of a broader increase in ownership off-exchange, regardless of the movement of assets within the institutional infrastructure.
Overall, these signals suggest that despite increasing long leverage, spot demand from large holders continues to underpin Ethereum’s recovery.
Ethereum Price Levels That May Determine the Next Direction of Movement
Currently, Ethereum is at a very crucial technical point. The first level to watch is the resistance area at the neckline, followed by the technical resistance around $2,320. If the price is able to break and hold above these levels, it could confirm the breakout strength of the inverse head and shoulders pattern.
If Ethereum manages to cross this resistance, the next big target is around $2,570. A breakout of the area could potentially pave the way towards the pattern’s projected target in the range of $2,730. If the bullish momentum is maintained, Ethereum even has the opportunity to continue rising to the $2,990 area in the short term.
While upside prospects are still open, downside risks remain, especially if leverage starts to unravel or investors start realizing profits. The nearest important support level is around $2,160, which is in line with the 0.618 Fibonacci retracement level. The next additional support is seen around $2,070.
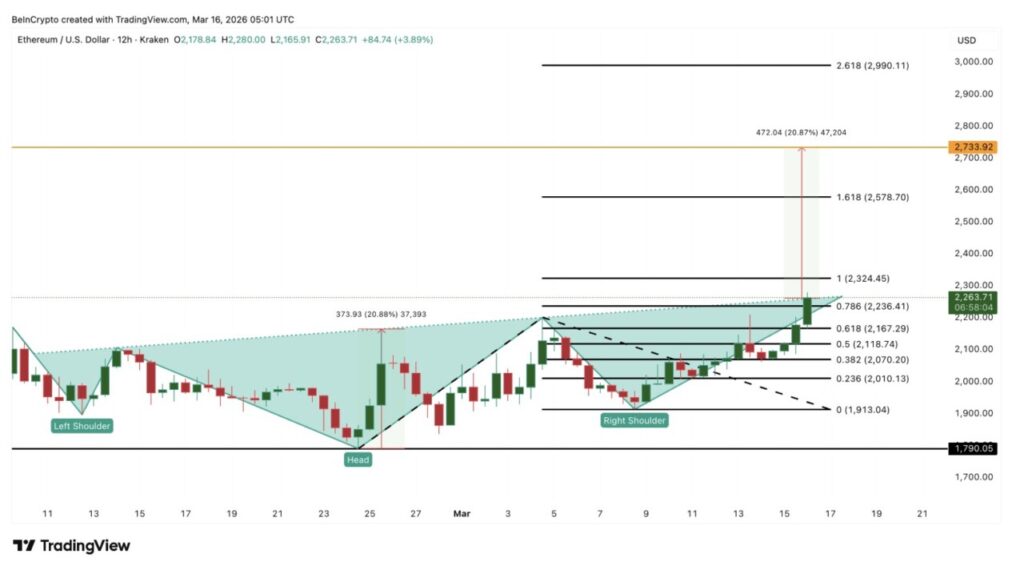
If the drop continues deeper to near $1,910, the bullish structure currently formed will weaken and indicate that the inverse head and shoulders pattern could potentially fail.
For now, Ethereum’s price structure still suggests an upward breakout opportunity. However, whether a 20% rally can actually materialize will be largely determined by the ability of long-term holder confidence and whale demand to absorb the volatility that comes with increased leverage.
Follow us on Google News to stay up to date with the latest in crypto and blockchain technology. Check Bitcoin price, usdt to idr and tokenized nvidia stock price via Pintu Market.
As a safe crypto app, Pintu provides a crypto trading experience to access crypto gold investment easily and conveniently. You can also see today’ s gold jewelry price and today’s gold bullion price to support your investment activities and portfolio diversification as well as learn crypto through Pintu Academy.
Download the Pintu crypto app via Play Store or App Store now. Enjoy web trading experience with advanced trading tools such as pro charting, various types of order types, and portfolio tracker only at Pintu Pro.
*Disclaimer
This content aims to enrich readers’ information. Pintu collects this information from various relevant sources and is not influenced by outside parties. Note that an asset’s past performance does not determine its projected future performance. Crypto trading activities are subject to high risk and volatility, always do your own research and use cold hard cash before investing. All activities of buying and selling Bitcoin and other crypto asset investments are the responsibility of the reader.
Reference:
- BeInCrypto. Ethereum Price Pattern Hints at 20% Rally Amid Rising Leverage Risk. Accessed on March 17, 2026
Latest News
© 2026 PT Pintu Kemana Saja. All Rights Reserved.
The trading of crypto assets is carried out by PT Pintu Kemana Saja, a licensed and regulated Digital Financial Asset Trader supervised by the Financial Services Authority (OJK), and a member of PT Central Finansial X (CFX) and PT Kliring Komoditi Indonesia (KKI). Crypto asset trading is a high-risk activity. PT Pintu Kemana Saja do not provide any investment and/or crypto asset product recommendations. Users are responsible for thoroughly understanding all aspects related to crypto asset trading (including associated risks) and the use of the application. All decisions related to crypto asset and/or crypto asset futures contract trading are made independently by the user.