2 Altcoins Worth to Watch: XRP and XLM Surge, Derivative Data Reinforces Bullish Signal
Jakarta, Pintu News – Ripple (XRP) and Stellar (XLM) started to stand out as two crypto assets to watch on Tuesday (17/3), as both continued to gain after breaking out of bullish patterns the day before. XRP is currently trading above an important resistance area, while XLM is moving higher after successfully breaking the downtrend line.
Derivatives data also reinforced this movement, as both assets recorded an increase in Open Interest (OI), indicating an influx of new funds into the market as well as the emergence of renewed buying pressure. These conditions have the potential to boost the ongoing price increase.
XRP and XLM Open Interest Signals Show Bullish Outlook
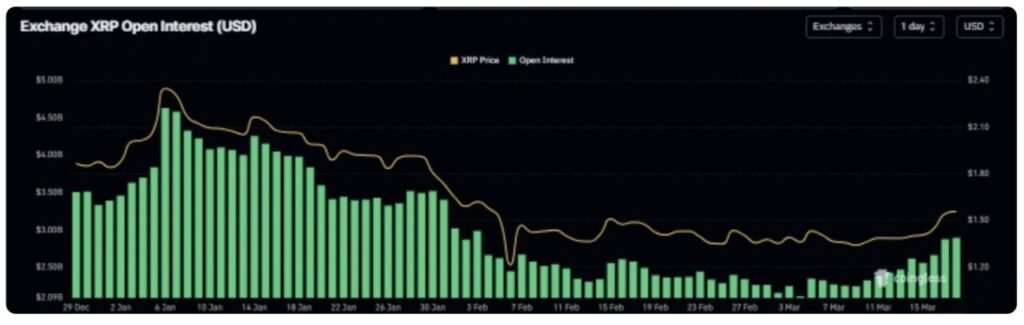
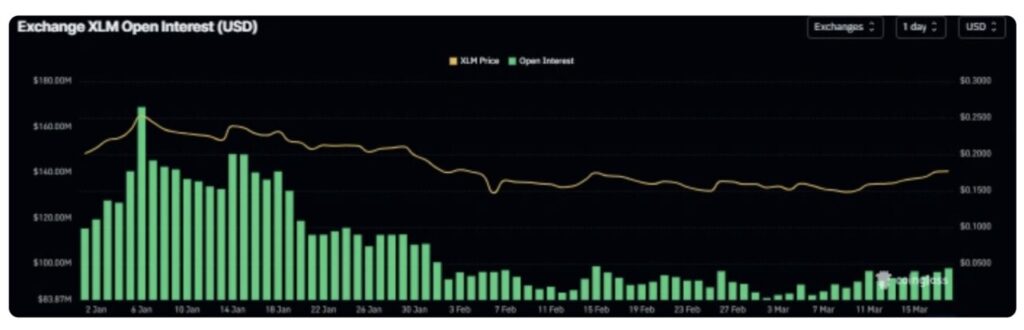
CoinGlass data shows the Open Interest (OI) of XRP and XLM jumped to $2.89 billion and $97.78 million respectively on Tuesday (17/3). For XRP, the current OI position is at its highest level since early February, while XLM recorded its highest level since mid-February.
Read also: Bitcoin and Ethereum Slide, but These 5 Cryptos Are Gaining Ahead of Eid 2026
This increase in OI reflects an influx of new funds or additional liquidity into the market, while signaling renewed buying interest. This could be a further driver for the ongoing price rally of XRP and XLM.
XRP Technical Outlook: XRP Closes Above 50-Day EMA
XRP was trading at $1.54 on Tuesday (17/3) after surging more than 6% the previous day. Currently, XRP is still moving in a descending parallel channel pattern that started from the area above $2.80.
However, the latest bounce off the support around $1.30 as well as a rise through the mid-$1.40 area changes the short-term bias to bullish as long as the support level is maintained. Prices are now moving above the 50-day Exponential Moving Average (EMA), but still below the 100-day EMA, signaling an early recovery phase amid the broader correction structure.
The Relative Strength Index (RSI) indicator on the daily chart is at 63, which shows that the upward momentum is still strong without entering overbought conditions. Meanwhile, the Moving Average Convergence Divergence (MACD) line is above the signal line and also above the zero line, with a positive histogram that further confirms the strengthening of bullish pressure.
Initial support is at $1.45, the area where the latest low was accumulated. Below that, there is a stronger horizontal support at $1.30, the level that supported the last bounce as well as the lower limit of the current recovery scenario. If the price drops through $1.30, bearish pressure could potentially return and open up room for a drop towards the bottom of the channel around $1.11, weakening the initial bullish outlook.
Read also: Altcoin Volumes Tumble as Investor Interest Fades and Capital Rotation Begins to Emerge
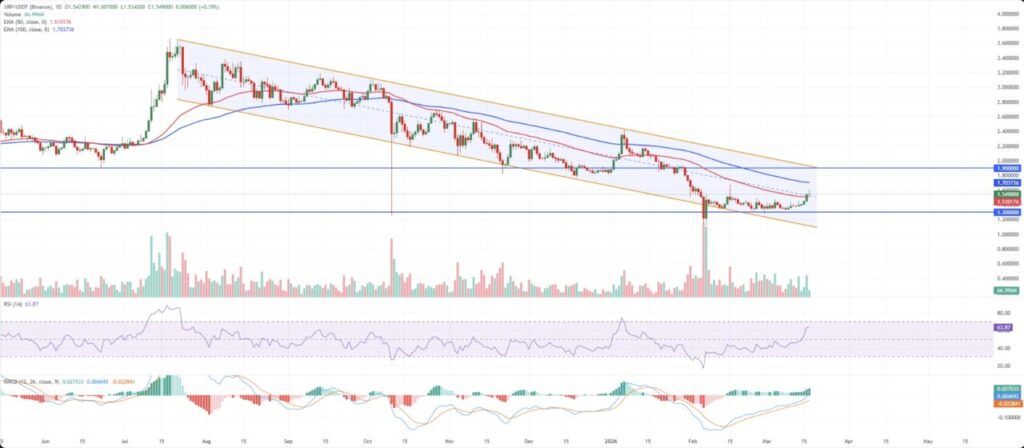
On the upside, the nearest resistance is at $1.60, followed by the $1.75 level which is in line with the previous price reaction peaks within the channel. If XRP is able to record a daily close above $1.75, then an upside opportunity towards the horizontal resistance at $1.90 will open up. In that area, the upper limit of the descending channel is also expected to be an upside barrier on the first test.
XLM Technical Outlook: XLM Closed Above the Descending Trendline
XLM price briefly traded at $0.176 on Tuesday (17/3) after successfully breaking the downtrend line on the previous day. In the short term, XLM’s movement bias is now cautiously bullish, after the price continued to rebound after the latest consolidation phase and closed above the 50-day EMA at $0.171.
Nevertheless, XLM is still moving quite far below the 100-day EMA which is around $0.195. However, the recent price push towards the previous trendline breakout area around $0.170 suggests that the market sentiment is starting to improve.
In terms of momentum, the indicators also favor a more constructive view. The RSI on the daily chart rose to the 64 level and managed to break out of the previous mid-range. Meanwhile, the MACD line moved above the signal line in positive territory, accompanied by a widening histogram, indicating the upward pressure is getting stronger.
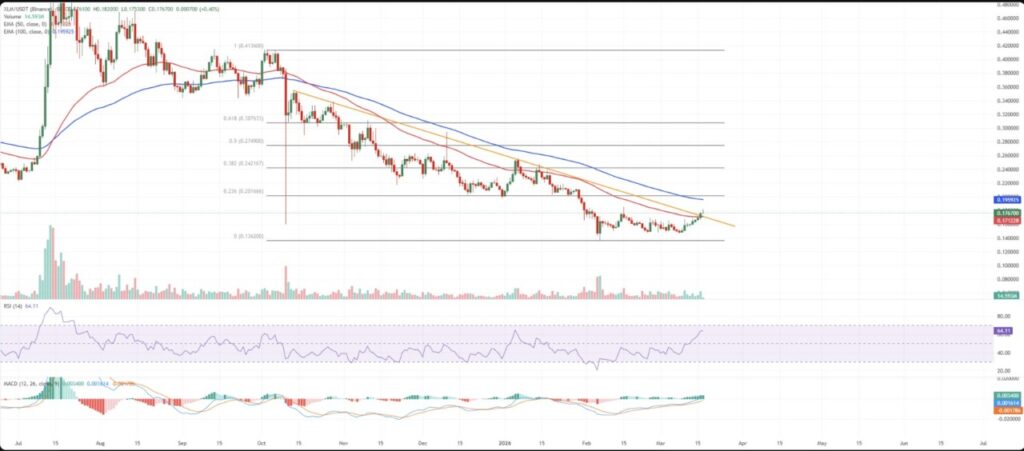
Initial resistance is now at the 23.6% Fibonacci retracement level of the $0.136 to $0.413 decline, at $0.201. This area is adjacent to the 100-day EMA cluster, so it could potentially be an upside limit in the current rebound. If the price is able to break this level clearly, then the upside opportunity could continue towards the 38.2% retracement at $0.242.
On the downside, the nearest support is seen around $0.170, near the area of the price break of the previous downtrend resistance line at $0.171. After that, the next support is at $0.160, which is the area where the lowest point was formed during the last consolidation phase.
If XLM closes daily below $0.160 again, then the initial bullish bias will weaken and prices could potentially move back towards the broader range around $0.150.
Follow us on Google News to stay up to date with the latest in crypto and blockchain technology. Check Bitcoin price, usdt to idr and tokenized nvidia stock price through Pintu Market.
As a safe crypto app, Pintu provides a crypto trading experience to access crypto gold investment easily and conveniently. You can also see today’ s gold jewelry price and today’s gold bullion price to support your investment activities and portfolio diversification as well as learn crypto through Pintu Academy.
Download the Pintu crypto app via Play Store or App Store now. Enjoy web trading experience with advanced trading tools such as pro charting, various types of order types, and portfolio tracker only at Pintu Pro.
*Disclaimer
This content aims to enrich readers’ information. Pintu collects this information from various relevant sources and is not influenced by outside parties. Note that an asset’s past performance does not determine its projected future performance. Crypto trading activities are subject to high risk and volatility, always do your own research and use cold hard cash before investing. All activities of buying and selling Bitcoin and other crypto asset investments are the responsibility of the reader.
Reference:
- FX Street. Altcoins to watch: XRP and XLM rally as derivatives data signal bullish momentum. Accessed on March 20, 2026
Latest News
© 2026 PT Pintu Kemana Saja. All Rights Reserved.
The trading of crypto assets is carried out by PT Pintu Kemana Saja, a licensed and regulated Digital Financial Asset Trader supervised by the Financial Services Authority (OJK), and a member of PT Central Finansial X (CFX) and PT Kliring Komoditi Indonesia (KKI). Crypto asset trading is a high-risk activity. PT Pintu Kemana Saja do not provide any investment and/or crypto asset product recommendations. Users are responsible for thoroughly understanding all aspects related to crypto asset trading (including associated risks) and the use of the application. All decisions related to crypto asset and/or crypto asset futures contract trading are made independently by the user.