Bitcoin Holds at $70,000 as Retail Demand Shows Signs of Weakness
Jakarta, Pintu News – Bitcoin (BTC) is showing mixed signals as demand from retail investors remains weak, while the short-term price structure is trying to recover. One chart indicates that small investor participation is declining, while the other shows that the bullish camp is trying to defend support levels after a liquidity sweep.
Then, how is the current Bitcoin price movement?
Bitcoin Price Drops 0.04% in 24 Hours
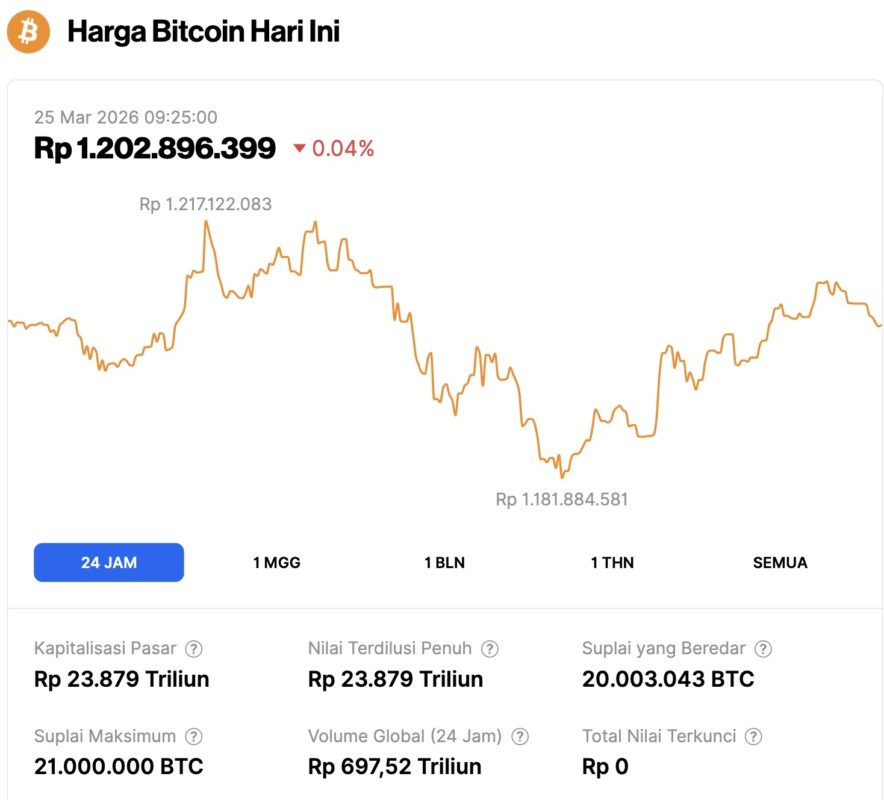
As of March 25, 2026, Bitcoin was trading at $70,621, or around IDR 1,202,896,399, after slipping 0.04% over the past 24 hours. During that time, BTC fell to a daily low of IDR 1,181,884,581 and climbed as high as IDR 1,217,122,083.
At the time of writing, Bitcoin’s market capitalization stood at approximately IDR 23,879 trillion, while its 24-hour trading volume dropped 21% to IDR 697.52 trillion.
Read also: 2 Altcoins Worth Monitoring: XRP and XLM Surge, Derivative Data Reinforces Bullish Signal
Bitcoin Retail Demand Weakens as Activity Below $10,000 Remains Negative
Retail activity in the Bitcoin market still looks weak, based on a CryptoQuant chart that CryptoTice analysts shared on X. The data shows that demand from $0 to $10,000 transactions remains in the negative zone on a 30-day basis, despite Bitcoin still holding at relatively high price levels.
The chart tracks 30-day changes in retail investor demand and compares it to the price of Bitcoin. In the most recent reading, the indicator was in the range of minus 10% to minus 15%, indicating that small investors are continuing to reduce their activity instead of re-entering the market.
However, Bitcoin price did not move down following the pattern. The chart shows the asset is still trading well above the levels seen in 2022 and 2023, indicating a gap between price strength and retail participation. This suggests that recent market support may be coming from sources other than small-scale buyers.
CryptoTice said that similar retail slowdowns had also appeared before the Bitcoin bear market in previous periods. The chart shows several phases when retail demand fell sharply before or during broader market weakness. Even so, this data alone is not enough to confirm that a new bear market has begun.
Instead, the data highlights one clear trend: small-scale investor participation is still weak. Retail traders have often been the drivers of stronger bull market phases. For now, the group remains rather absent, which could limit further upside potential unless demand below the $10,000 range starts to recover.
Read also: Pantera Capital Highlights These 4 Crypto Trends Amid Market Panic!
Bitcoin returns to its ascending channel after dropping below $68,000
Bitcoin is moving back into an ascending channel after briefly falling below the lower boundary in the $68,000 area, according to a market update shared by Columbus analysts at X. This movement comes after what analysts call a liquidity sweep, which is a brief drop below the support level that then reverses direction as the price recovers back to its previous structure.
The four-hour chart combined with the MMT heatmap shows Bitcoin returning to the bottom of the channel after the breakdown failed to continue. Columbus thinks this change improves the short-term structure and leads to more stable conditions, although he emphasizes that further confirmation is still needed before concluding the potential for a stronger rebound.
The chart also shows a concentration of bid liquidity near the lower trendline. That area is now a key level to watch. If buyers continue to be able to defend that zone, this structure could potentially push the move back to the middle area of the channel, which analysts estimate to be around $74,000.
Columbus said this latest movement reflects a fairly common market pattern after a liquidity sweep. In this pattern, the price drops towards the downside liquidity area, triggering a sell-off or forced exit, and then begins to stabilize after the pressure subsides. As a result, the area that previously pulled the price down may start to turn into support, rather than a downside target.
This change is important as it could mark a pause in bearish pressure, rather than a continuation of the downtrend. On the heatmap, the lower area of the channel is still in line with the apparent bid liquidity, thus supporting the near-term stabilization scenario as long as the level remains intact.
For now, the chart shows that Bitcoin has reclaimed an important technical structure after losing it briefly. The next movement will largely depend on whether the lower boundary of the ascending channel remains able to hold as support after the latest liquidity sweep.
Follow us on Google News to stay up to date with the latest in crypto and blockchain technology. Check Bitcoin price, usdt to idr and tokenized nvidia stock price through Pintu Market.
As a safe crypto app, Pintu provides a crypto trading experience to access crypto gold investment easily and conveniently. You can also see today’ s gold jewelry price and today’s gold bullion price to support your investment activities and portfolio diversification as well as learn crypto through Pintu Academy.
Download the Pintu crypto app via Play Store or App Store now. Enjoy web trading experience with advanced trading tools such as pro charting, various types of order types, and portfolio tracker only at Pintu Pro.
*Disclaimer
This content aims to enrich readers’ information. Pintu collects this information from various relevant sources and is not influenced by outside parties. Note that an asset’s past performance does not determine its projected future performance. Crypto trading activities are subject to high risk and volatility, always do your own research and use cold hard cash before investing. All activities of buying and selling Bitcoin and other crypto asset investments are the responsibility of the reader.
Reference:
- Coinpaper. Bitcoin Price Prediction: Weak Retail Meets Channel Recovery. Accessed on March 25, 2026
Latest News
© 2026 PT Pintu Kemana Saja. All Rights Reserved.
The trading of crypto assets is carried out by PT Pintu Kemana Saja, a licensed and regulated Digital Financial Asset Trader supervised by the Financial Services Authority (OJK), and a member of PT Central Finansial X (CFX) and PT Kliring Komoditi Indonesia (KKI). Crypto asset trading is a high-risk activity. PT Pintu Kemana Saja do not provide any investment and/or crypto asset product recommendations. Users are responsible for thoroughly understanding all aspects related to crypto asset trading (including associated risks) and the use of the application. All decisions related to crypto asset and/or crypto asset futures contract trading are made independently by the user.