Ethereum Holds Near $2,100 Today, but a 17% Correction Risk Is Building
Jakarta, Pintu News – As of March 24, 2026, the price of Ethereum (ETH) is trading at around $2,130, up 8.2% in the past month. This intraday increase also attracted whale interest and encouraged the opening of large long positions. However, the 8-hour chart is slowly forming a pattern that has the potential to erase these gains, even deeper.
The mismatch between on-chain optimism and technical risk is a major highlight in this environment. Ethereum whales and leveraged traders see an upside opportunity. In contrast, the chart structure suggests a potential decline of up to 17%. One of these two sides will eventually prove to be wrong, and the EMA cluster currently right around the price is likely to be the next bellwether of direction.
Then, how is Ethereum’s current price movement?
Ethereum Price Drops 0.02% in 24 Hours
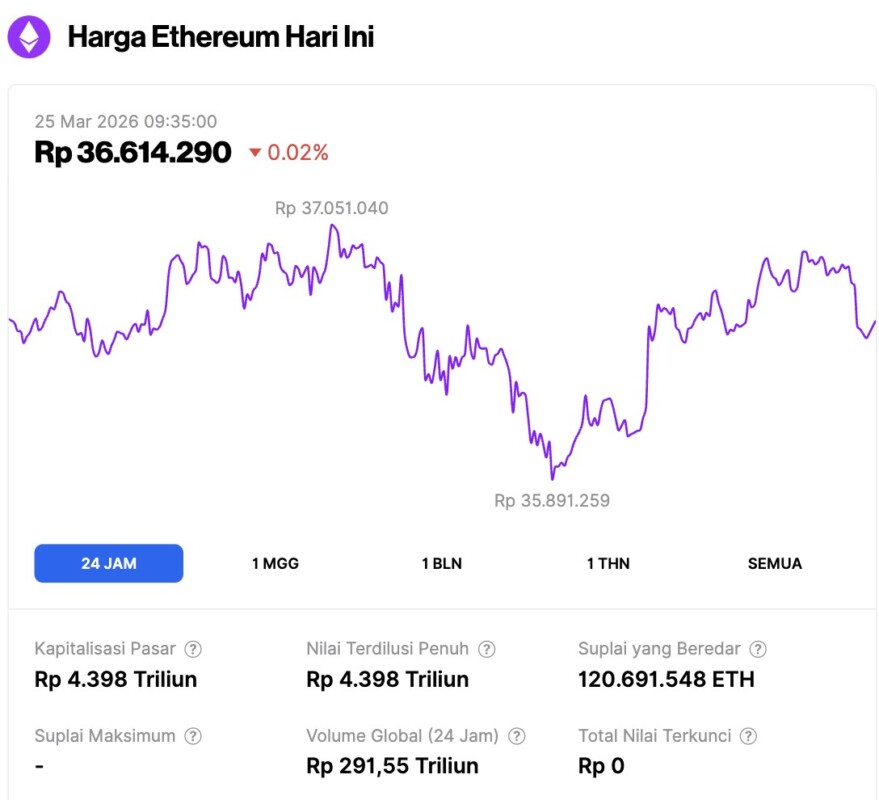
As of March 25, 2026, Ethereum was trading at around $2,159, or approximately IDR 36,614,290, down 0.02% over the past 24 hours. During that time, ETH fell to a daily low of IDR 35,891,259 and reached a high of IDR 37,051,040.
At the time of writing, Ethereum’s market capitalization stood at roughly IDR 4,398 trillion, while its 24-hour trading volume dropped 35% to IDR 291.55 trillion.
Read also: Bitcoin Holds at $70,000 as Retail Demand Shows Signs of Weakness
Whale and Derivative Positioning Show Strong Bullish Bias
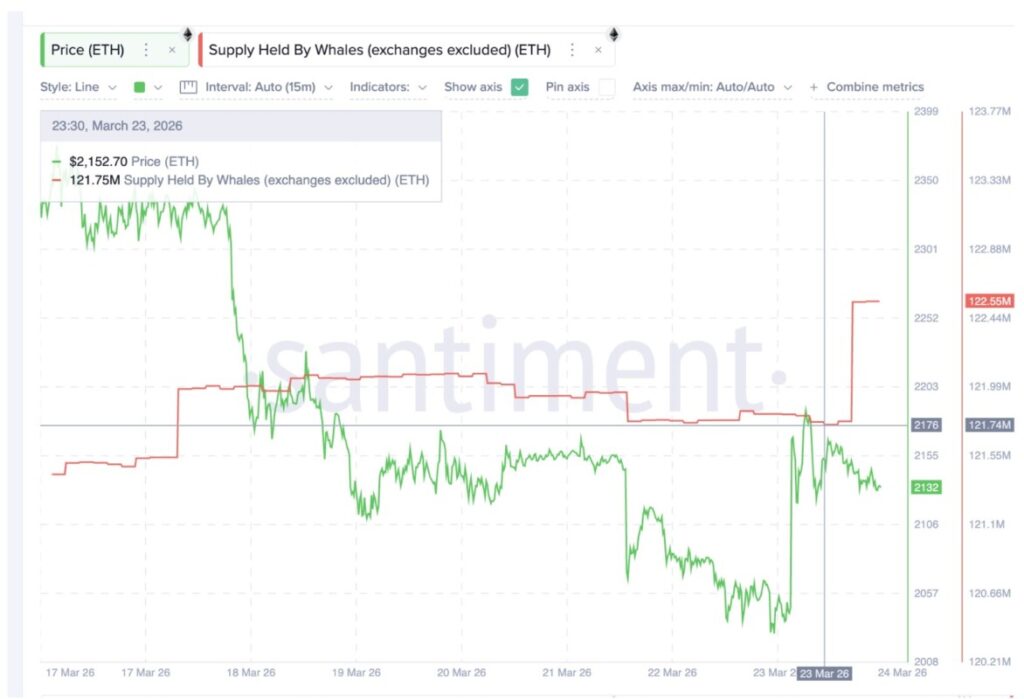
Ethereum whales are starting to move aggressively. According to Santiment data, the supply of ETH held by whales, outside of wallet exchanges, rose from 121.74 million ETH on March 23 to 122.55 million ETH in 24 hours (3/24).
This means that there was a net addition of approximately 810,000 ETH in a day, worth approximately $1.7 billion at current prices. The timing of this move is in line with the intraday rebound, indicating that the whales are accumulating as the strengthening momentum begins to emerge.
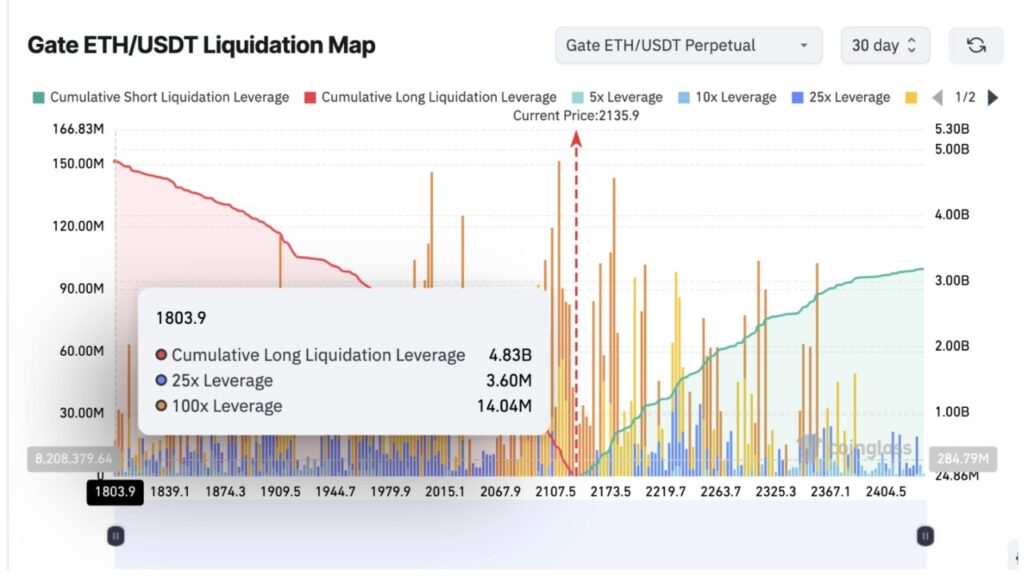
Ethereum’s derivatives positioning also reinforces the bullish view. The ETH/USDT perpetual gate liquidation map for the past 30 days shows an accumulated long leverage of $4.83 billion, compared to a short leverage of $3.18 billion. This means that long positions are about 52% larger than short positions. In other words, the market is currently quite biased towards a bullish scenario.
When whales buy in the spot market and derivatives positions simultaneously go long, this generally reflects strong conviction in the near-term outlook. However, market conviction is not always stronger than chart structure. And the pattern that is forming on the 8-hour chart is something that the bullish camp should not ignore.
The 8-Hour Chart Forms a Pattern that May Have Escaped the Bull’s Attention
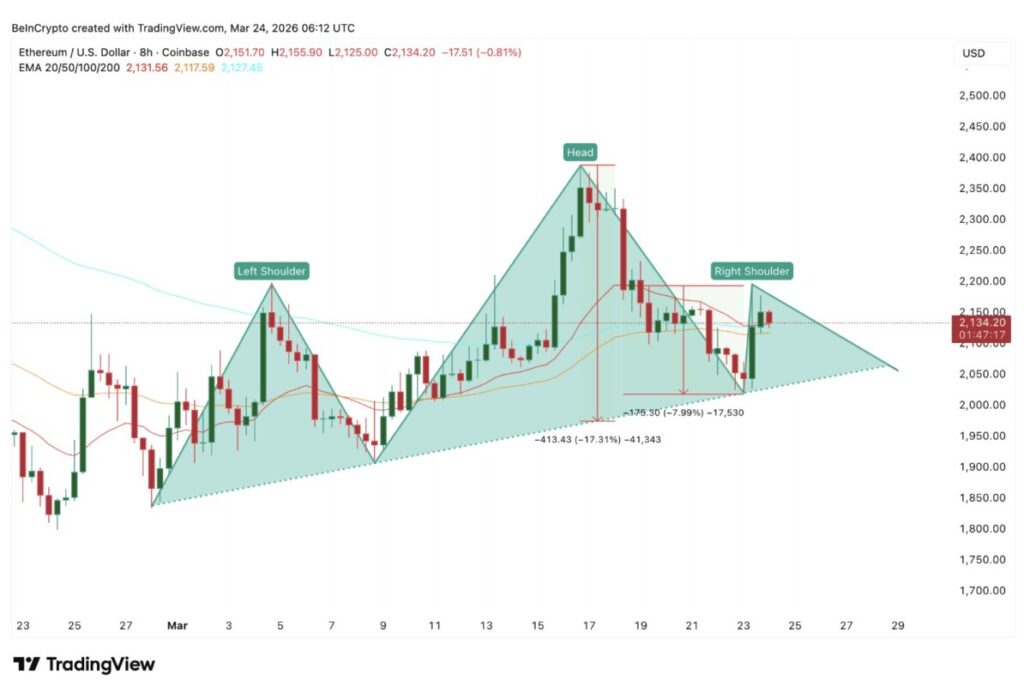
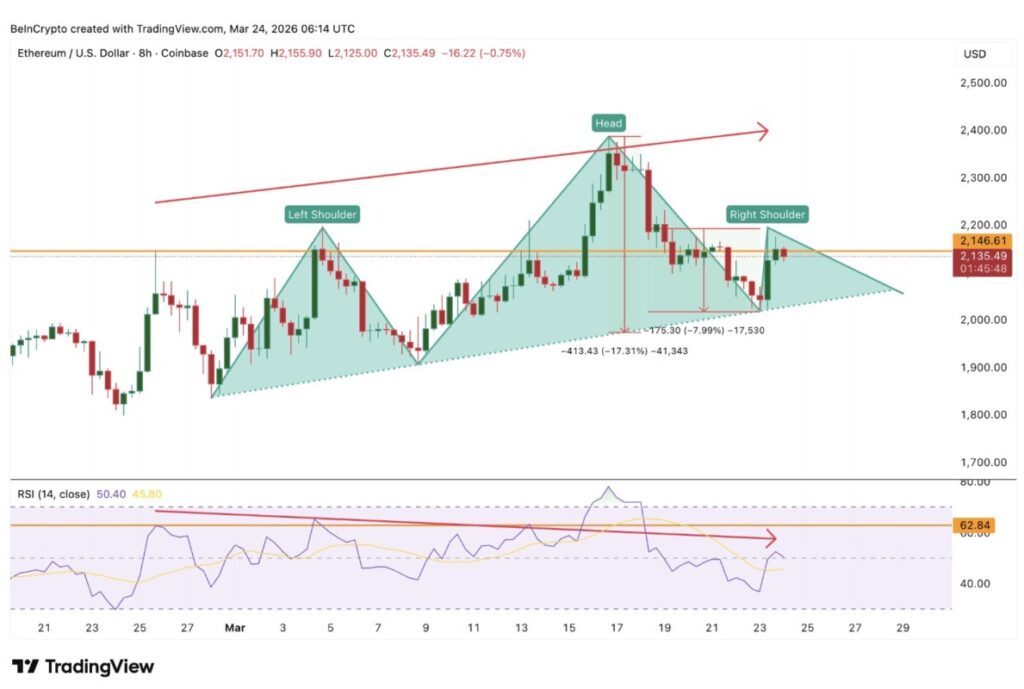
The 8-hour chart shows the formation of a head and shoulders pattern with a rising neckline and a correction target of around 17%. The ascending neckline generally reflects buying pressure that remains below the price, in line with whale accumulation.
However, when that buying impulse fails to sustain the price, the downward movement that ensues usually tends to be sharper as the support levels that buyers previously relied on disappear.
This risk is heightened because Ethereum’s price is currently just above the EMA cluster. The 20-, 50-, and 100-period Exponential Moving Averages (EMAs), which are indicators that smooth out price data to help identify trend direction, are all converging in the range of $2,110 to $2,130. When multiple EMAs converge on one price area, a breakout in either direction usually triggers a faster movement.
The last time ETH fell through the 20-period EMA on the 8-hour chart, on March 18, it corrected about 8%.
Read also: Pantera Capital Highlights These 4 Crypto Trends Amid Market Panic!
The downside risk is also reinforced by the bearish RSI divergence. In the period from February 25 to March 23, the ETH price formed higher peaks on the candles, while the Relative Strength Index (RSI), a momentum indicator, formed lower peaks. This kind of bearish divergence generally indicates that the upward momentum is starting to weaken even though the price is still moving up.
Combined, the head and shoulders pattern, the EMA cluster in a crucial position, and the bearish RSI divergence form a technical picture that contradicts the optimism of both the whales and the derivatives market. Ultimately, it is the price movements at these important levels that will determine which narrative proves to be correct.
Ethereum Price is Right in the Direction Area
The immediate battle zone is at $2,110, which is in line with the lower limit of the EMA cluster. If the 8-hour candle closes below this area, the support of the moving averages will be broken and selling pressure could potentially increase towards $2,050.
The $2,050 level is particularly important as it coincides with the 0.382 Fibonacci level as well as the neckline of the head and shoulders pattern. If this area is broken on the 8-hour chart close, then the downside target of the pattern will be active.
The pattern head is formed around $2,380, and this structure leads to a potential drop of around 17% from the neckline, with a target around $1,700. On the way, the levels of $1,970 and $1,830 could be temporary holding areas. Meanwhile, the deepest downside scenario is around $1,600.
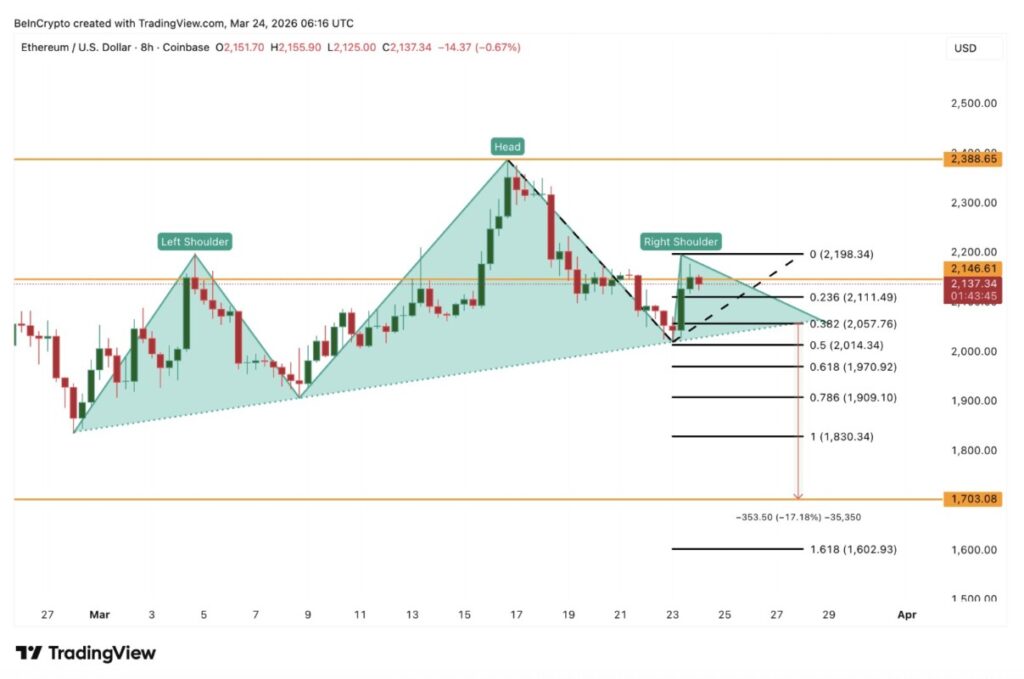
ETH price drop below $2,050 could also trigger a long liquidation cascade. With an accumulated long leverage of $4.83 billion still piling up below the current price, a neckline break could potentially force market participants with leveraged long positions to close their positions, creating additional selling pressure that accelerates the decline towards the head and shoulders pattern target.
Under these conditions, positions that originally reflected bullish conviction may turn into fuel for a bearish scenario if the pattern is confirmed.
To invalidate this bearish pattern, ETH needs to break $2,190 again by the close of the 8-hour chart, and then resume its rise above the top of the head at around $2,380. Only then can the head and shoulders pattern be declared a failure.
For now, Ethereum price is still above the EMA cluster which is the thin line between whale accumulation-driven optimism and the 17% correction risk of the head and shoulders pattern.
Follow us on Google News to stay up to date with the latest in crypto and blockchain technology. Check Bitcoin price, usdt to idr and tokenized nvidia stock price via Pintu Market.
As a safe crypto app, Pintu provides a crypto trading experience to access crypto gold investment easily and conveniently. You can also see today’ s gold jewelry price and today’s gold bullion price to support your investment activities and portfolio diversification as well as learn crypto through Pintu Academy.
Download the Pintu crypto app via Play Store or App Store now. Enjoy the web trading experience with various advanced trading tools such as pro charting, various types of order types, and portfolio tracker only at Pintu Pro.
*Disclaimer
This content aims to enrich readers’ information. Pintu collects this information from various relevant sources and is not influenced by outside parties. Note that an asset’s past performance does not determine its projected future performance. Crypto trading activities are subject to high risk and volatility, always do your own research and use cold hard cash before investing. All activities of buying and selling Bitcoin and other crypto asset investments are the responsibility of the reader.
Reference:
- BeInCrypto. Ethereum Price Bounce Has Bulls Rushing In: Are They Overlooking a 17% Warning? Accessed on March 25, 2026
Latest News
© 2026 PT Pintu Kemana Saja. All Rights Reserved.
The trading of crypto assets is carried out by PT Pintu Kemana Saja, a licensed and regulated Digital Financial Asset Trader supervised by the Financial Services Authority (OJK), and a member of PT Central Finansial X (CFX) and PT Kliring Komoditi Indonesia (KKI). Crypto asset trading is a high-risk activity. PT Pintu Kemana Saja do not provide any investment and/or crypto asset product recommendations. Users are responsible for thoroughly understanding all aspects related to crypto asset trading (including associated risks) and the use of the application. All decisions related to crypto asset and/or crypto asset futures contract trading are made independently by the user.