BTC/Gold Correlation Plummets to 3-Year Low, Strong Signal BTC Has Reached ‘Bottom’?
Jakarta, Pintu News – An interesting phenomenon is happening in the digital assets and precious metals markets. The correlation between Bitcoin (BTC) and gold in March 2024 reached its lowest point in three years. This has led to speculation that Bitcoin (BTC) has formed a bottom and is poised for a comeback. Analysts and market participants are now highlighting this unusual move as an important signal for the future of the Bitcoin (BTC) price.
BTC/Gold Ratio: A Strong Indication of Bitcoin’s (BTC) Low Point
The ratio between Bitcoin (BTC) and gold is one of the indicators that many analysts are watching. Michaël van de Poppe, a renowned analyst, highlighted that the current 70% drop in the BTC/Gold ratio is very similar to historical patterns that mark the end of a 13-14 month bearish cycle.
In previous years, sharp declines in this ratio-86% in 2014, 83% in 2018, and 76% in 2022-were always followed by the formation of a bottom and the recovery of Bitcoin (BTC) prices. According to van de Poppe, the current BTC/Gold ratio chart shows signs of consolidation after a sharp decline.
This opens up the opportunity for Bitcoin (BTC) to start outperforming gold in the near future. He emphasized that this pattern is likely to repeat itself, given the consistent history. As such, many market participants are beginning to believe that Bitcoin (BTC) has bottomed out in March 2024.
Also read: SEC Ruling March 27, 2026: Will Ripple (XRP) Price Explode or Fall?
Bitcoin (BTC) and Gold Correlation Touches Lowest Level, What Does It Mean?
Data from CryptoQuant reinforces the analysis conducted by van de Poppe. In March, the correlation index between Bitcoin (BTC) and gold dropped to -0.9, the lowest level since late 2022. During that period, Bitcoin (BTC) briefly touched $15,600 before starting a bullish trend that lasted more than two years.
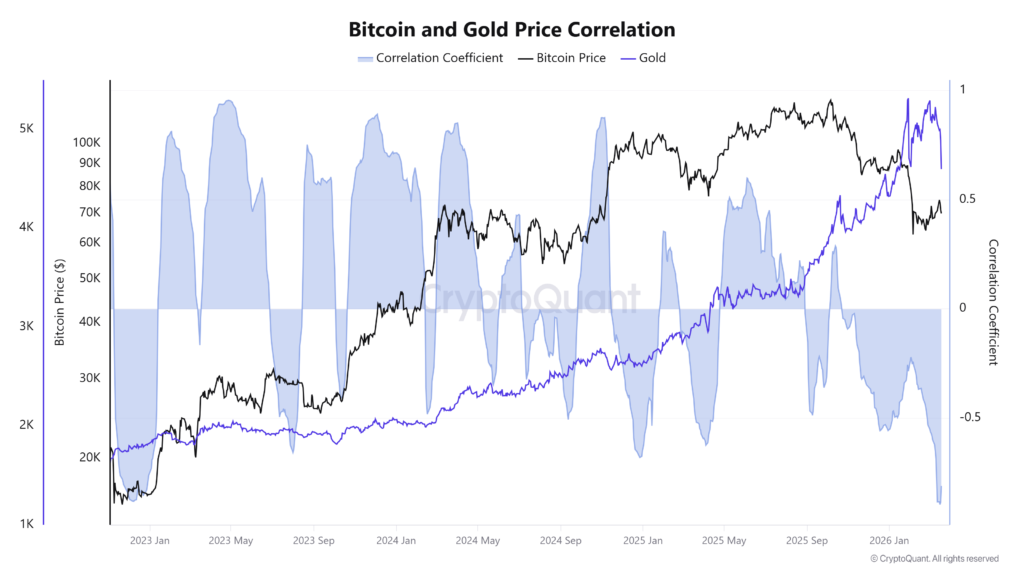
This negative correlation signals that the price movements of the two assets are increasingly opposite. Meanwhile, veteran trader Peter Brandt identified a bearish pattern on the gold chart known as the “Nine Red Birds”.
This pattern consists of nine consecutive downward daily closes, and according to Brandt, has only happened four times in his career. The pattern is often followed by a very long recovery period for gold. The combination of gold’s bearish outlook and negative correlation with Bitcoin (BTC) reinforces the notion that Bitcoin (BTC) has formed a bottom in March 2024.
Also read: Bitcoin (BTC) Beats Gold: 23% Surge Amid Conflict, Is $75,000 Next?
Factors Causing Divergence: Bitcoin (BTC) Is More Resilient to Geopolitical Turmoil
Swissblock, an institutional market data and analytics company, provides an interesting explanation for the divergence between Bitcoin (BTC) and gold. According to Swissblock, Bitcoin (BTC) responds faster to emerging geopolitical risks, such as the escalation of the Iran conflict in early March.
Bitcoin (BTC) experienced selling pressure first, but was able to recover very quickly compared to gold. Swissblock asserts that Bitcoin’s (BTC) quick response to geopolitical shocks shows better adaptability than traditional assets.
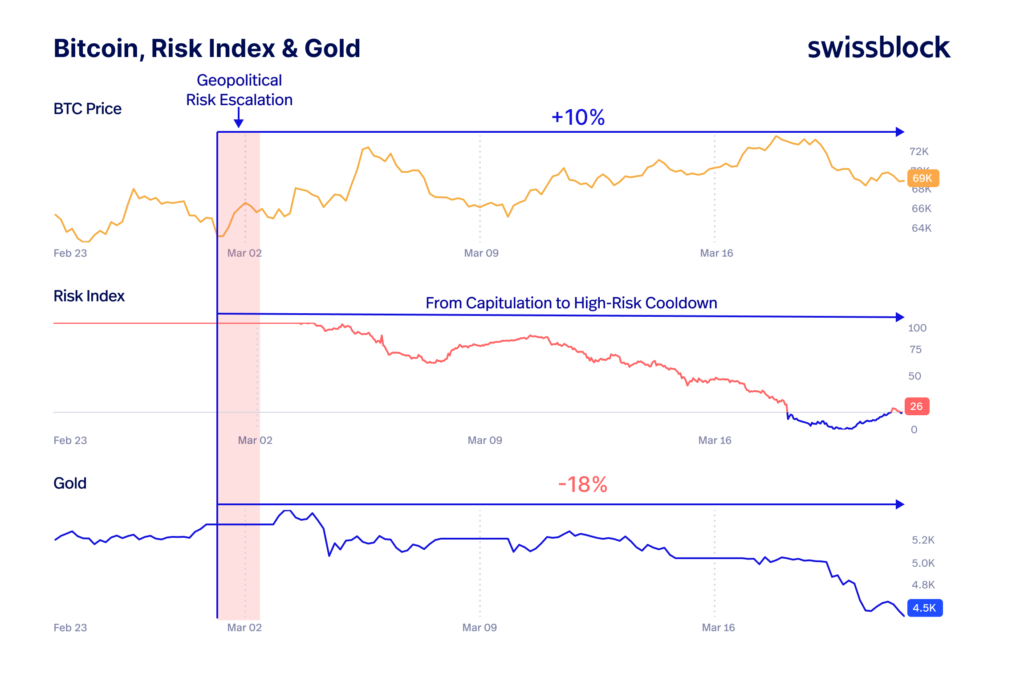
This proves that Bitcoin (BTC) is no longer seen as an asset vulnerable to systemic crises. Instead, Bitcoin (BTC) has shown resilience and the ability to recover faster from external pressures. This condition further strengthens Bitcoin (BTC)’s position as a digital asset that deserves to be taken into account amid global uncertainty.
Follow us on Google News to stay up to date with the latest in crypto and blockchain technology. Check Bitcoin price, usdt to idr and tokenized nvidia stock price through Pintu Market.
As a safe crypto app, Pintu provides a crypto trading experience to access crypto gold investment easily and conveniently. You can also see today ‘ s gold jewelry price and today ‘ s gold bullion price to support your investment activities and portfolio diversification as well as learn crypto through Pintu Academy.
Download the Pintu crypto app via Play Store or App Store now. Enjoy the web trading experience with various advanced trading tools such as pro charting, various types of order types, and portfolio tracker only at Pintu Pro.
*Disclaimer
This content aims to enrich readers’ information. Pintu collects this information from various relevant sources and is not influenced by outside parties. Note that an asset’s past performance does not determine its projected future performance. Crypto trading activities are subject to high risk and volatility, always do your own research and use cold hard cash before investing. All activities of buying and selling Bitcoin and other crypto asset investments are the responsibility of the reader.
Reference
- BeInCrypto. BTC-Gold Ratio Hints at End of Bear Market. Accessed on March 25, 2026
- Featured Image: Currency Transfer
Latest News
© 2026 PT Pintu Kemana Saja. All Rights Reserved.
The trading of crypto assets is carried out by PT Pintu Kemana Saja, a licensed and regulated Digital Financial Asset Trader supervised by the Financial Services Authority (OJK), and a member of PT Central Finansial X (CFX) and PT Kliring Komoditi Indonesia (KKI). Crypto asset trading is a high-risk activity. PT Pintu Kemana Saja do not provide any investment and/or crypto asset product recommendations. Users are responsible for thoroughly understanding all aspects related to crypto asset trading (including associated risks) and the use of the application. All decisions related to crypto asset and/or crypto asset futures contract trading are made independently by the user.