AI Crypto Surges 10% — These 3 Tokens Lead the Rally and Outperform the Market
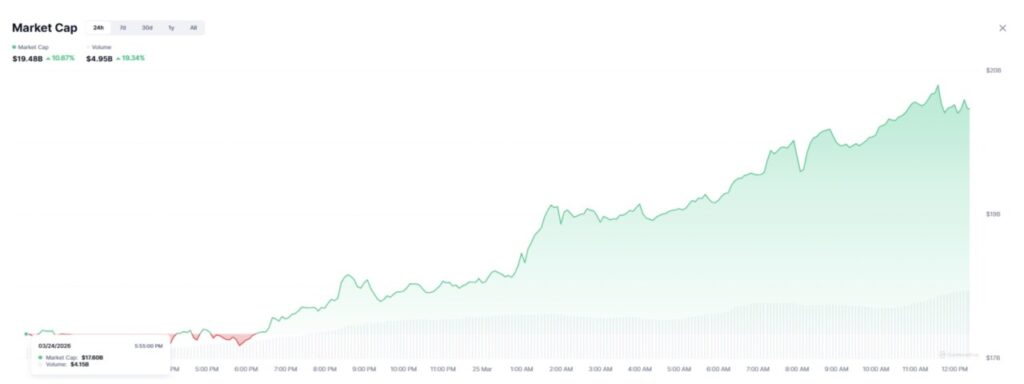
Jakarta, Pintu News – The AI-based crypto sector surged 10.67% on March 25, 2026, pushing its total market capitalization from $17.60 billion to $19.48 billion in just one trading session.
At the same time, transaction volume also rose 19.34% to reach $4.95 billion, indicating that this increase was supported by real market participation, not just a price spike due to thin liquidity.
In line with these movements, here are three AI crypto coins that managed to perform above expectations in 24 hours (25/3).
AI Crypto Market Surge
The main driver of this rise came from macroeconomic factors. President Trump’s decision to suspend strikes on Iran for five days triggered a change in sentiment towards riskier assets in global markets. Oil prices fell sharply, S&P 500 futures (SPYX) rallied, and crypto markets moved up.
Read also: Pi Network Price Prediction: PI Still Under Pressure, Will PI Coin Fall Deeper?
In the crypto market, AI tokens that had been under continuous selling pressure throughout most of the first quarter are now registering much larger gains. This is because investor appetite for riskier assets has returned, resulting in capital flows driven by market narratives back into the sector.
Previously, Grayscale’s research division had highlighted AI tokens as one of the two sectors that showed relative resilience throughout the first quarter of 2026. Today’s movement shows that this positioning is starting to show positive results.
Artificial Superintelligence Alliance (FET)
Artificial Superintelligence Alliance (FET) is trading at $0.2551 on the daily chart (25/3), up 5.20% on the day after recovering from a low of $0.2409. The Fibonacci retracement grid on the chart is drawn from the cycle low at $0.1398 to the peak of the move at $0.2569.
Currently, the price is heading towards the 1.0 extension level, while the previous measured move target of 70.59% from the $0.1398 base area has been reached.
The most prominent indicator on this chart is the On-Balance Volume (OBV). Throughout March, the OBV has continued to move up following a clear ascending trend line, and currently stands at 7.55 billion.
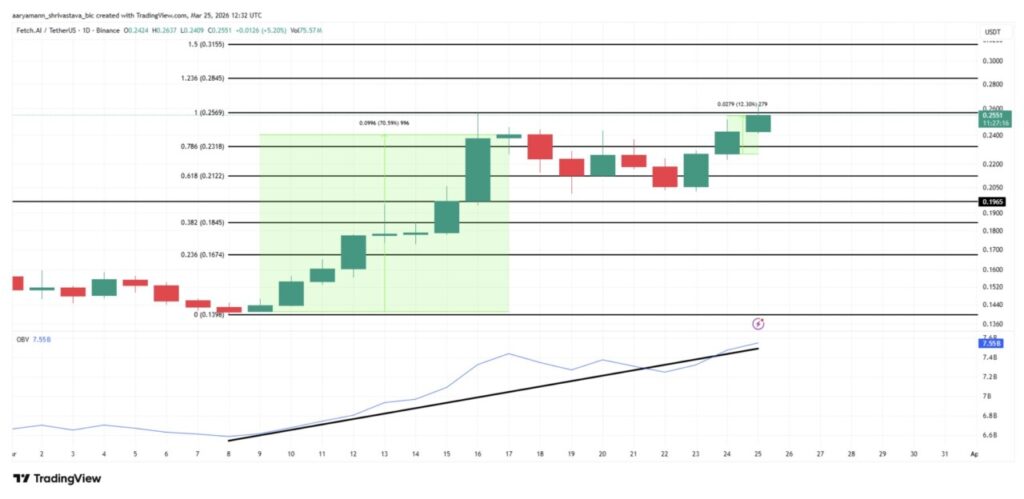
Importantly, the OBV maintained its upward trend even when prices corrected in the period from March 17 to 23. This pattern of rising OBV as prices weakened indicates that selling pressure was successfully absorbed by buyers without triggering a significant pullback, which generally reflects real accumulation rather than a short-term speculative impulse.
For the bullish scenario to continue, FET needs to record a daily close above the $0.2569 level, which is the Fibonacci 1.0 extension as well as the previous swing high. If the level is successfully broken, the next targets are at the 1.236 extension at $0.2845, then the 1.5 extension at $0.3155.
Conversely, the bullish scenario will be invalidated if the price closes daily below $0.1965, which is the horizontal support area seen on the chart. If this level is broken downwards, the recovery structure of the price could potentially be broken and open up opportunities for a decline towards the $0.1845 zone.
Siren (SIREN)
One of the other crypto coins that recorded a strong performance today was SIREN, which was trading at $2.37 after surging 132.02% in one session. This is one of the strongest daily movements in the AI sector.
On the daily chart (25/3), the price seems to have reclaimed the $2.00 area after a 67.10% drop to $0.83. Meanwhile, the Money Flow Index (MFI) indicator stands at 76.38, signaling that it has entered overbought territory.
However, the Chaikin Money Flow (CMF) indicator at -0.12 is giving a more cautious signal. Despite the sharp jump in price, the CMF is still in the negative area. The declining trendline formed since the previous peak suggests that the dollar-weighted buying volume has not really dominated the recent movement. This divergence between the price surge and the CMF remaining negative is a warning signal for the market.
Read also: Dogecoin Price Weakens Today: Qubic Goes 3x Faster, DOGE Potentially Soars 300%?
Currently, the altcoin is still about 120% away from reaching the all-time high of $4.72 again. The all-time high was formed at the end of last week and is still not too far away from SIREN’s current price.
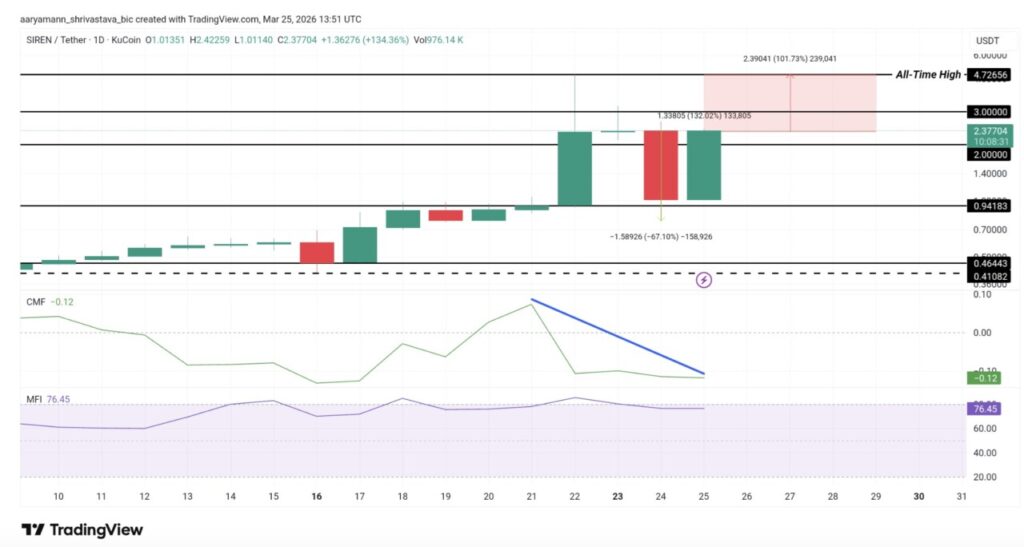
In a bullish scenario, the next upside target points to $2.59, provided that SIREN is able to hold above the $2.00 level during a pullback. The blue uptrend line on the price chart, which has been the area of support throughout the rally from $0.40, is now around $1.10 and serves as the basis of the movement structure.
Conversely, this scenario will be invalidated if the price closes daily below $0.94. This level previously acted as support during the consolidation phase. If this area is breached, the 110% rally that occurred could be considered a momentary spike due to market fatigue, rather than the start of a sustained uptrend. With the MFI already at 76.38, the more likely short-term scenario is a brief consolidation before further movement occurs.
Bittensor (TAO)
Bittensor (TAO) briefly traded at $355 on March 25, after breaking strongly through the 61.8% Fibonacci retracement level of $306. The Fibonacci grid on the chart is drawn from the cycle low at $142 to the previous peak around $589. The current move is characterized as a measured increase of 21.07% from the breakout area, with prices making it to $355.
The two exponential moving averages (EMAs) also show similar signals, namely the potential for a Golden Cross to form. The 50-day EMA (blue) is at $269, while the 200-day EMA (red) is at $233. Both are now below the current price, and TAO has clearly broken both levels.
After months of moving below both moving averages during the correction phase from December to February, the recovery of prices above the 50-day EMA and 200-day EMA in March signaled a change in market structure from bearish to bullish.
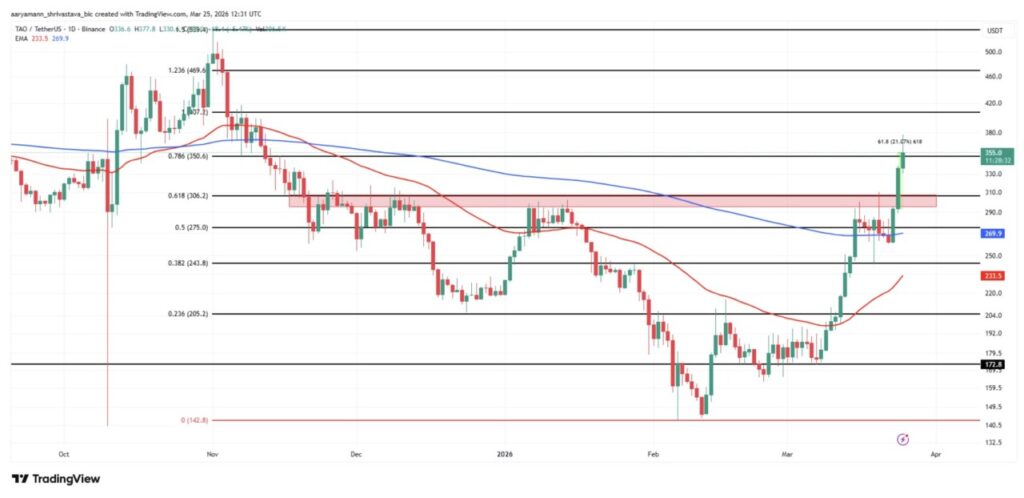
The red demand zone is in the range of $285 to $310. This area previously served as resistance throughout December and January, but has now turned into support.
TAO tested the zone during the pullback on March 24 and was able to hold, thus reinforcing the validity of the breakout. The next target above the current price is the 78.6% Fibonacci level at $350. After that, the next target is at the 1.0 extension of the previous peak area around $407. The next higher target is at the 1,236 extension, which is $469.
Grayscale’s TAO ETF filing is still a structural catalyst that is yet to be fully reflected in the market price. On the other hand, this bullish scenario will be canceled if the price closes daily again below $306. This will confirm that the breakout at the 61.8% Fibonacci level is just a fakeout.
If that happens, then the market’s attention will likely return to the 50% level at $275 as well as the 0.382 level at $243 as the next areas of support.
Follow us on Google News to stay up to date with the latest in crypto and blockchain technology. Check Bitcoin price, usdt to idr and tokenized nvidia stock price via Pintu Market.
As a safe crypto app, Pintu provides a crypto trading experience to access crypto gold investment easily and conveniently. You can also see today’ s gold jewelry price and today’s gold bullion price to support your investment activities and portfolio diversification as well as learn crypto through Pintu Academy.
Download the Pintu crypto app via Play Store or App Store now. Enjoy the web trading experience with various advanced trading tools such as pro charting, various types of order types, and portfolio tracker only at Pintu Pro.
*Disclaimer
This content aims to enrich readers’ information. Pintu collects this information from various relevant sources and is not influenced by outside parties. Note that an asset’s past performance does not determine its projected future performance. Crypto trading activities are subject to high risk and volatility, always do your own research and use cold hard cash before investing. All activities of buying and selling Bitcoin and other crypto asset investments are the responsibility of the reader.
Reference:
- BeInCrypto. AI Crypto Jumped 10% Today – 3 Coins Leading the Charge. Accessed on March 26, 2026
Latest News
© 2026 PT Pintu Kemana Saja. All Rights Reserved.
The trading of crypto assets is carried out by PT Pintu Kemana Saja, a licensed and regulated Digital Financial Asset Trader supervised by the Financial Services Authority (OJK), and a member of PT Central Finansial X (CFX) and PT Kliring Komoditi Indonesia (KKI). Crypto asset trading is a high-risk activity. PT Pintu Kemana Saja do not provide any investment and/or crypto asset product recommendations. Users are responsible for thoroughly understanding all aspects related to crypto asset trading (including associated risks) and the use of the application. All decisions related to crypto asset and/or crypto asset futures contract trading are made independently by the user.