Bitcoin’s 40% Decline May Not Be Over Yet—Here Are 4 Reasons Prices Could Fall Further
Jakarta, Pintu News – Bitcoin (BTC) price is currently hovering around $68,500 after having corrected around 40% from its mid-January peak of $98,000. Meanwhile, the recovery since hitting the February low of $60,000 is starting to show signs of weakening.
The bullish channel that forms after a sharp decline can indeed be seen as a signal of recovery. However, the presence of hidden RSI divergence, declining confidence of long-term investors, reduced loss pressure on short-term holders, as well as liquidation maps reflecting excessive optimism all point to similar conclusions.
Hidden Divergence Appears Inside the Rising Channel
Since early February, Bitcoin price has been moving inside an ascending parallel channel on the daily chart, a pattern that formed after a nearly 40% drop from $98,000 to the $60,000 area. An ascending channel that appears after a sharp correction often serves as a trend continuation pattern, which means that this consolidation phase is likely to end with continued weakness instead of an upward breakout.
Read also: Crypto Fear and Greed Index is at Level 29, Why is the Crypto Market Crashing?
The Relative Strength Index (RSI) indicator, which is used to measure momentum, formed a hidden bearish divergence on the daily timeframe. In the period from February 2 to March 25, the price recorded lower highs, while the RSI formed higher highs. A hidden bearish divergence generally signals that the main trend, in this case the broader downtrend, has the potential to continue even if the price briefly looks to be recovering.
A similar pattern also appeared in the period from February 2 to March 4. After the signal was confirmed, the price of BTC corrected by about 11% in the next few sessions. The most recent divergence was confirmed on March 25, and since then Bitcoin has started moving down.
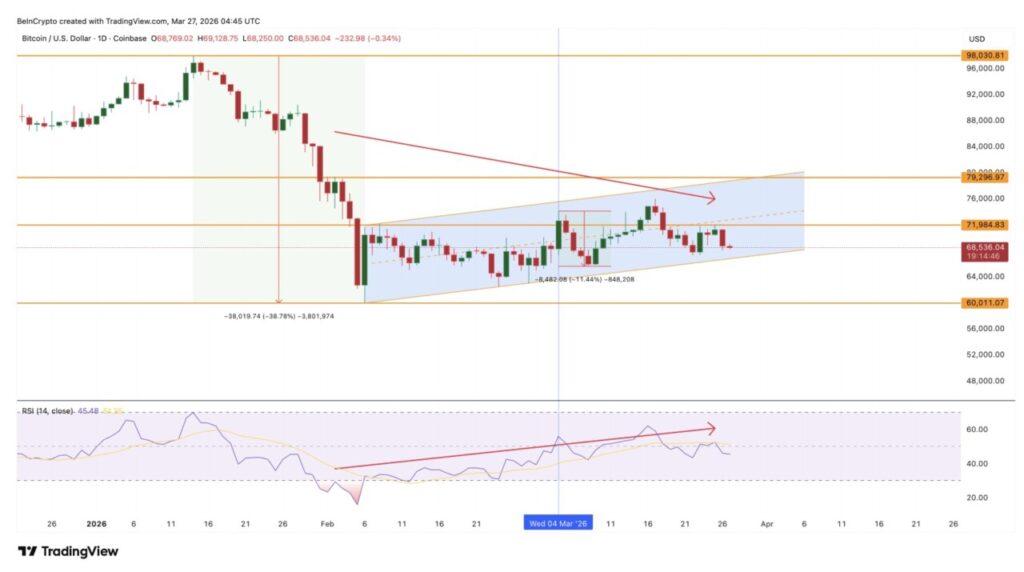
The lower trend line of the channel is now not too far away. If the price closes daily below that level, the bullish structure will be broken and the bearish view will be further validated.
However, the RSI signal alone is not enough to confirm whether the correction this time is deep enough to take the price to the bottom of the channel. To understand this, on-chain data on investor confidence provides additional context.
Investor Confidence Weakens, While Short-Term Losses Remain Limited
Bitcoin hodler net position change-a metric from Glassnode that tracks the 30-day average accumulation by wallets holding BTC for more than 155 days-reached a peak of 46,462 BTC on March 15. However, on March 26, the figure dropped to 35,278 BTC, a loss of about 24%.
Despite a slight recovery since March 24, the overall trend since mid-March still shows a decline. This group of medium-term holders, often considered the foundation of market conviction, started to reduce their accumulation rate even though Bitcoin price is still moving in an upward channel.
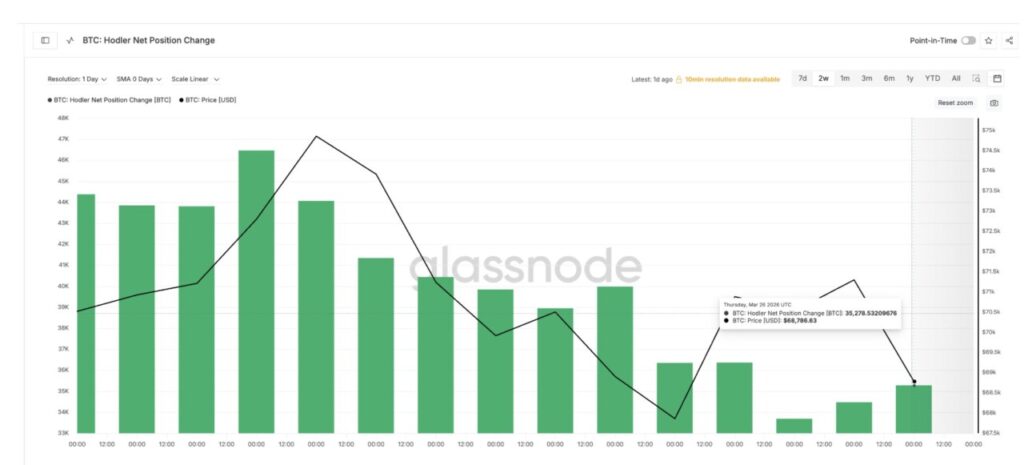
This behavior indicates that they are not yet fully convinced that the rebound reflects continued upside potential.
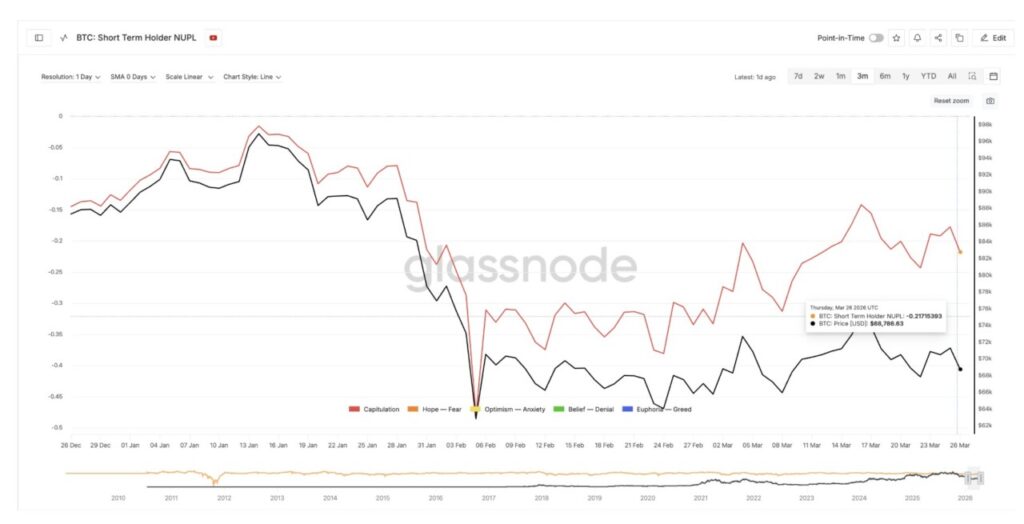
On the short-term holder side, there is an additional layer of risk. The short-term holder net unrealized profit/loss (NUPL) indicator, which measures the aggregate level of profitability for wallets with BTC holdings of less than 155 days, currently stands at -0.21. This puts it in the capitulation zone.
However, when Bitcoin hit $62,800 in early February, the NUPL had dropped to -0.47, indicating a much deeper state of capitulation. The current level of -0.21, despite the price being only slightly higher at $68,500, indicates that short-term holders are now incurring much smaller losses than at the February low.
If the hodler’s conviction continues to weaken and the price breaks below the channel, this group could potentially take the weakening support as a signal to sell, which could accelerate the price decline.
Read also: Bitcoin is Ready for Volatility, Here are 4 US Economic Data to Watch!
This on-chain data illustrates market conditions where confidence is slowly eroding. Meanwhile, the derivatives market will show whether traders have anticipated this scenario or are still in a risky position.
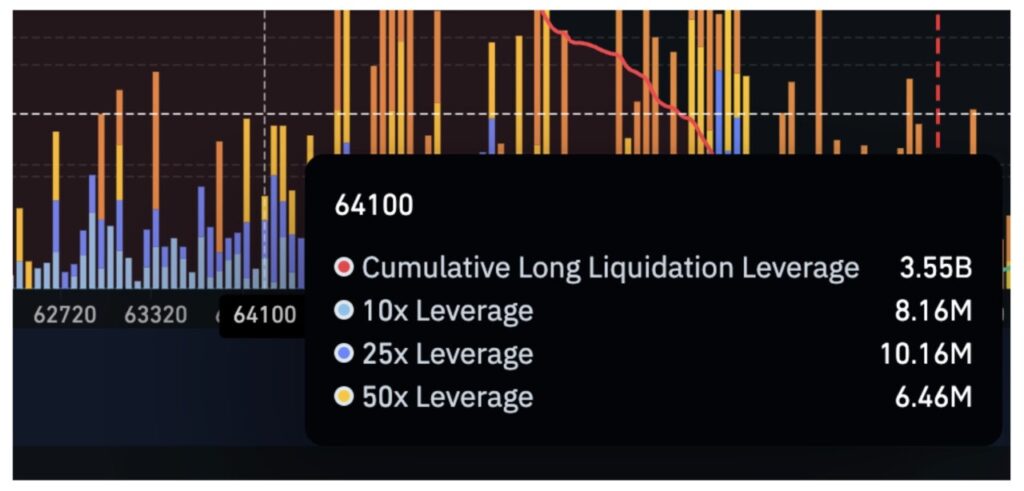
Bitcoin price faces long liquidation wall at $64,000
The BTC/USDT perpetual gate liquidation map for 30 days of active positions shows that the market is still optimistic. The total leverage of long liquidations was recorded at $4.21 billion, slightly higher than the leverage of short liquidations which stood at $4.13 billion.
The composition seems balanced at first glance, but the large long exposure amidst a volatile market adds some risk, which is the fourth reason why the potential for a deeper decline remains open.
Despite the nearly 40% correction and ongoing weakness, the majority of leveraged positions are still on the bullish side.
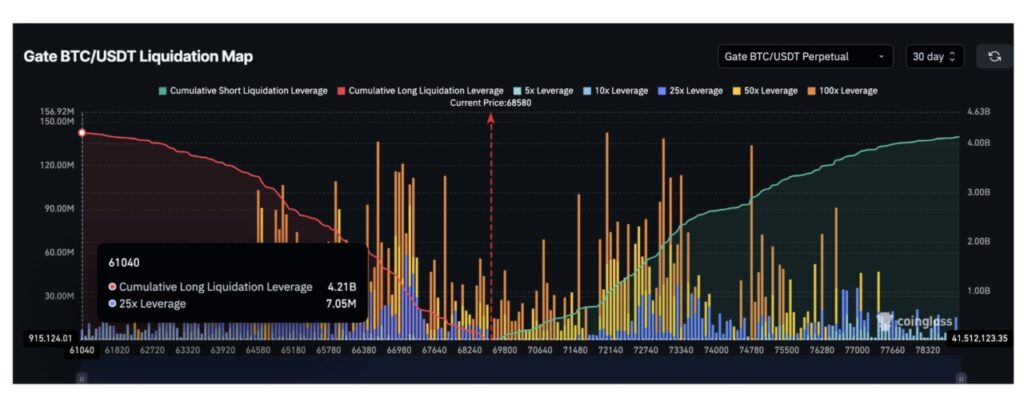
The largest concentration of long liquidations is in the $64,100 area, with total long leverage reaching $3.55 billion. This means that about 84% of all open long liquidation leverage could be triggered at or above this price level.
The move towards $64,100, or the $64,000 zone, is also in line with the 0.618 Fibonacci retracement level. Therefore, this area is a crucial point both in terms of technicals and the derivatives market.
In the current price structure, the nearest decisive level is at $68,700. Bitcoin is testing this area. If it fails to hold above it, the price could potentially move down to $66,400, which is adjacent to the lower trend line of the up channel.
If the channel is broken to the downside, then $64,100 becomes the next big target. A drop to that area could trigger the liquidation of most long positions, creating a chain effect that could potentially push BTC down to $60,900 and even $56,800, levels that would deepen the 40% correction that has already taken place.
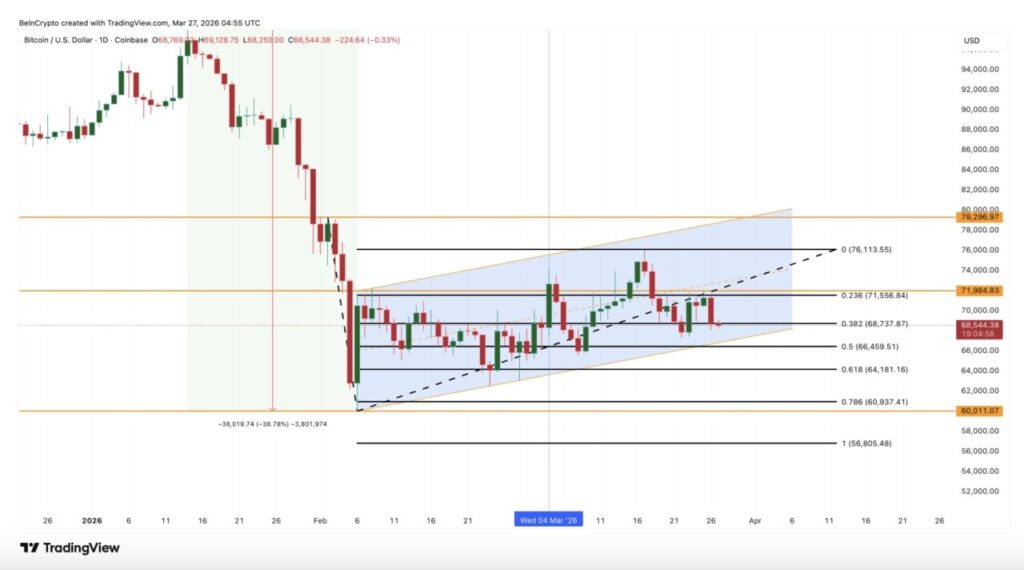
On the contrary, to ease the short-term bearish pressure, BTC needs to reclaim the $71,500 area. A new signal of bullish strength will be more obvious if the price is able to move above $76,100.
A daily close below $66,400 will break the ascending channel structure and open the risk of $3.55 billion long liquidation at $64,100. However, if BTC is able to break $71,500 again, the bearish scenario could be delayed and the chances of a rebound are maintained.
Follow us on Google News to stay up to date with the latest in crypto and blockchain technology. Check Bitcoin price, usdt to idr and tokenized nvidia stock price through Pintu Market.
As a safe crypto app, Pintu provides a crypto trading experience to access crypto gold investment easily and conveniently. You can also see today’ s gold jewelry price and today’s gold bullion price to support your investment activities and portfolio diversification as well as learn crypto through Pintu Academy.
Download the Pintu crypto app via Play Store or App Store now. Enjoy the web trading experience with various advanced trading tools such as pro charting, various types of order types, and portfolio tracker only at Pintu Pro.
*Disclaimer
This content aims to enrich readers’ information. Pintu collects this information from various relevant sources and is not influenced by outside parties. Note that an asset’s past performance does not determine its projected future performance. Crypto trading activities are subject to high risk and volatility, always do your own research and use cold hard cash before investing. All activities of buying and selling Bitcoin and other crypto asset investments are the responsibility of the reader.
Reference:
- BeInCrypto. Bitcoin’s 40% Correction Could Still Get Worse: 4 Reasons Why. Accessed on March 27, 2026
Latest News
© 2026 PT Pintu Kemana Saja. All Rights Reserved.
The trading of crypto assets is carried out by PT Pintu Kemana Saja, a licensed and regulated Digital Financial Asset Trader supervised by the Financial Services Authority (OJK), and a member of PT Central Finansial X (CFX) and PT Kliring Komoditi Indonesia (KKI). Crypto asset trading is a high-risk activity. PT Pintu Kemana Saja do not provide any investment and/or crypto asset product recommendations. Users are responsible for thoroughly understanding all aspects related to crypto asset trading (including associated risks) and the use of the application. All decisions related to crypto asset and/or crypto asset futures contract trading are made independently by the user.