Solana Price Prediction April 2026: How Will SOL Move?
Jakarta, Pintu News – Solana (SOL) prices entered April 2026 under pressure. March closed with a weakening of around -0.88%, extending the negative trend that has lasted for six consecutive months since October 2025.
On the daily chart, the head and shoulders pattern broke through the confirmation level on March 27, opening up the opportunity for a measured drop to the $73 area. Amid mixed signals from seasonal factors, on-chain demand, and holder behavior, April’s movement could potentially determine whether SOL is able to form a new support point or continue its decline.
Movement History Indicates Caution, and Daily Charts Reinforce That Signal
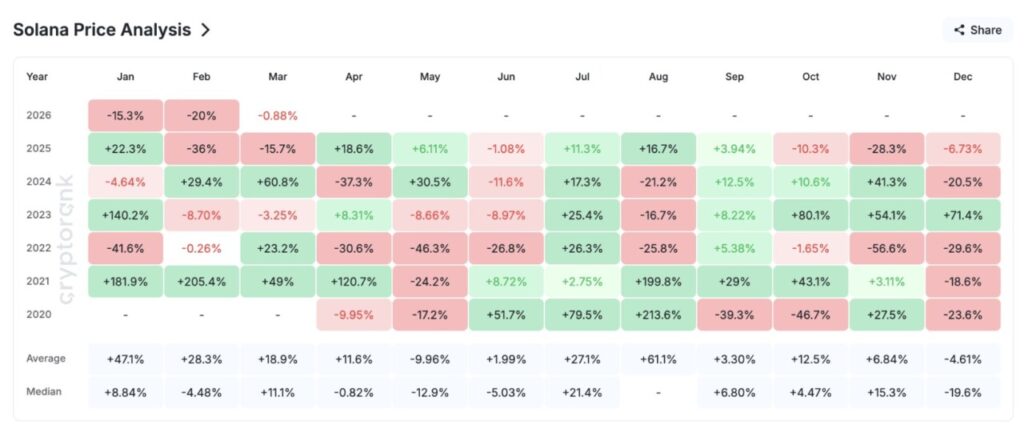
The monthly yield chart shows that Solana prices have not recorded a single green month since September 2025. In January 2026, SOL closed down 15.3%, then fell another 20% in February, while March is expected to end in the red with a decline of around 0.88%.
Read also: As 40% of Altcoins Approach Their Lowest Levels, These 22 Tokens Still Show Strength!
This means that Solana has posted six consecutive months of negative performance, a run of weakness that goes beyond its historical pattern. To illustrate, March has historically had a median return of 11.1%, but in 2026 it went the opposite way.
April did not provide much seasonal support either. Historically, SOL’s median return in April stands at -0.82%, making it one of the weakest months on record for price performance. As SOL has deviated from its seasonal pattern to the downside several times throughout 2026, relying on historical averages alone remains risky.
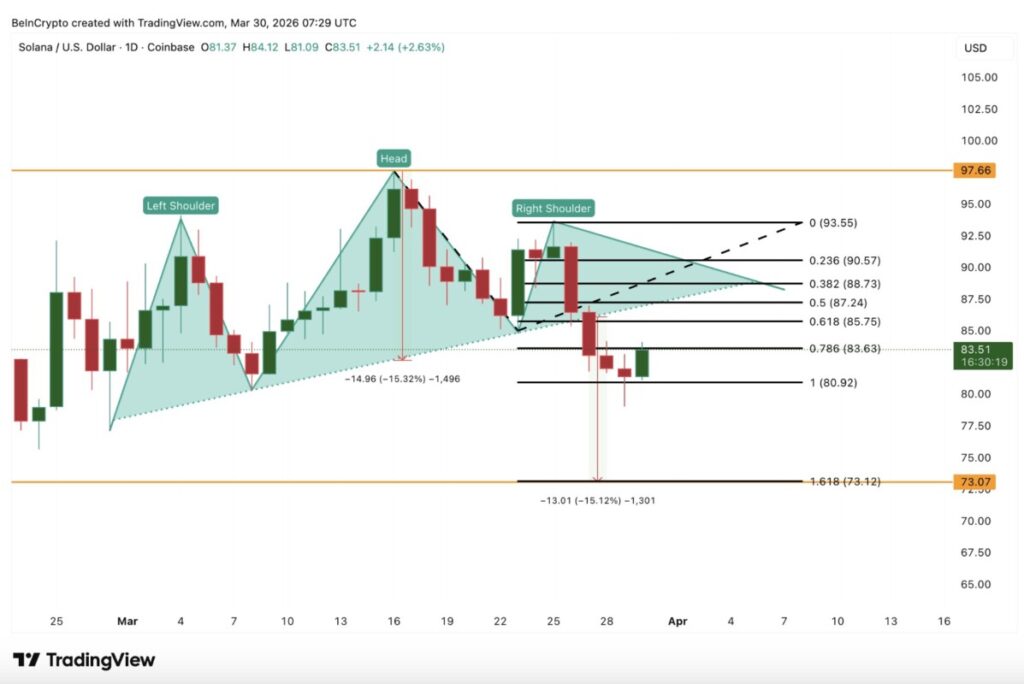
Bearish signals are also evident on the daily chart ahead of April. The head and shoulders pattern has completed its breakdown on March 27.
If calculated from the distance between the top of the head to the neckline after the breakdown, the next downside target points to the $73 area. This level indicates a potential additional correction of around 15%.
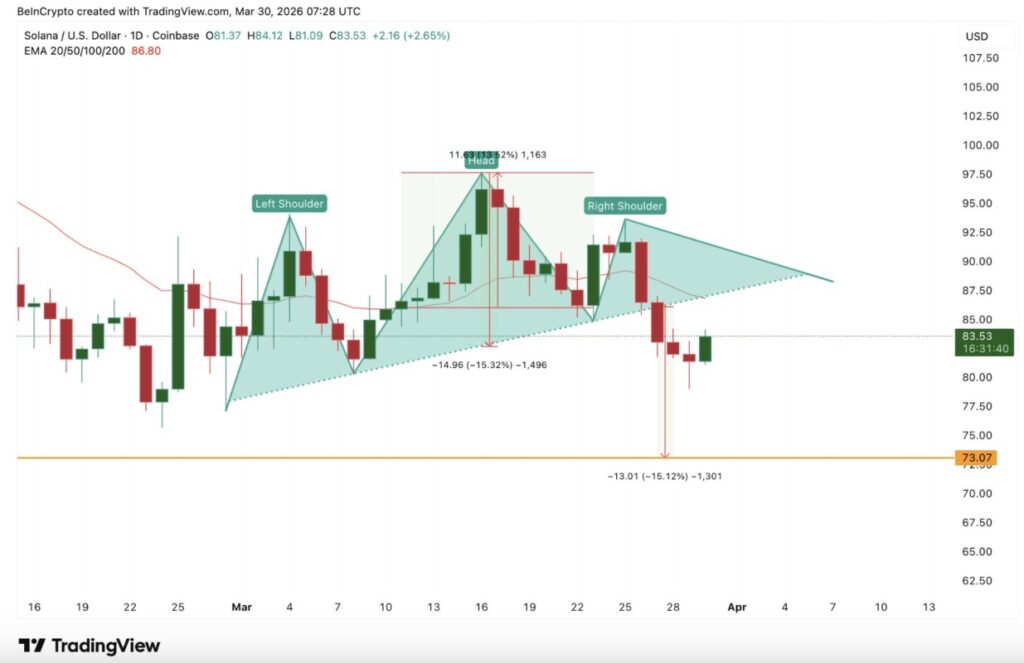
Meanwhile, the 20-day Exponential Moving Average (EMA) trend indicator, which gives more weight to recent price movements, is now around $86, $86.80 to be precise, and could be the last chance for SOL to try and recover.
The last time SOL was able to reclaim these levels, in early March, the price triggered a rally of around 13% which then formed the head of the pattern. As April approaches, the direction of SOL’s movement will be largely determined by whether the price is able to climb back above the 20-day EMA or continue to move below it.
However, on-chain metrics also warrant further scrutiny.
Demand on Exchanges Weakens as SOL Breakdown Begins to Form
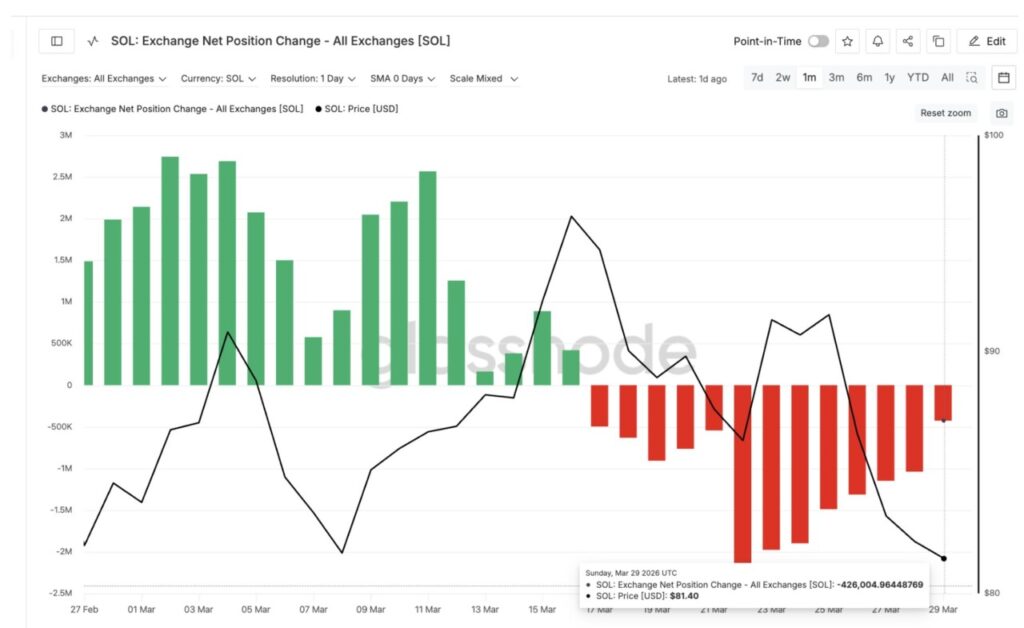
On-chain data shows that the buying pressure that had sustained SOL until mid-March started to dissipate ahead of April. Exchange net position change, a metric that measures the inflow and outflow of tokens from exchanges, previously reflected strong accumulation in the period from March 17 to 22, with a low of around -2,180,253 SOL. This negative number signifies tokens exiting the exchange, which is generally seen as a buying signal in the spot market.
However, since the head and shoulders pattern breakdown on March 27, the metric has dropped sharply to around -426,004 SOL as of March 29. This means that the buying pressure has dropped by about 80% in just one week.
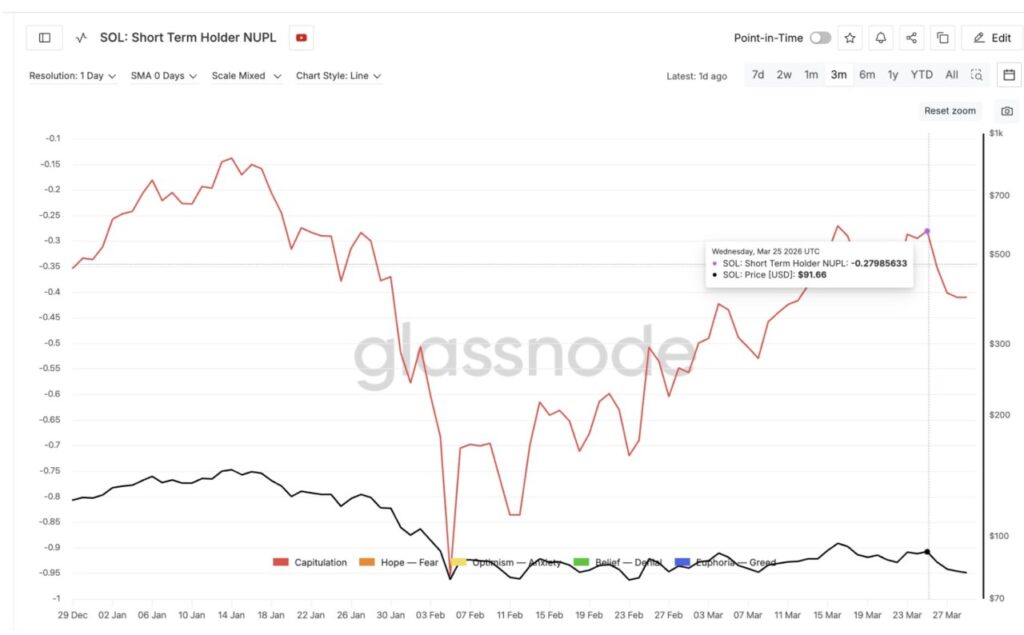
The short-term holder net unrealized profit/loss (NUPL) indicator, which measures the aggregate profitability of short-term holders, also added a layer of risk ahead of April.
STH NUPL rose significantly from the deep capitulation phase at -0.95 on February 5 to -0.27 on March 25. Currently, it stands at around -0.40. Although still negative, this position shows that short-term holders are now bearing much smaller losses compared to the previous few weeks.
Read also: Will Pi Network Price Strengthen Ahead of April 6 Node Upgrade Deadline?
This could be a problem. If spot demand does not recover throughout April, short-term holders could potentially opt to exit with more limited losses rather than staying in a continued breakdown phase. If renewed selling pressure emerges from this group, a move towards the $73 target could take place more quickly.
The combination of weakening demand on the exchanges and improving short-term holder loss positions ahead of April makes the SOL demand picture even more fragile, while the technical structure itself is already bearish.
Long-term Holder Provides Restraint, but History Curbs Optimism
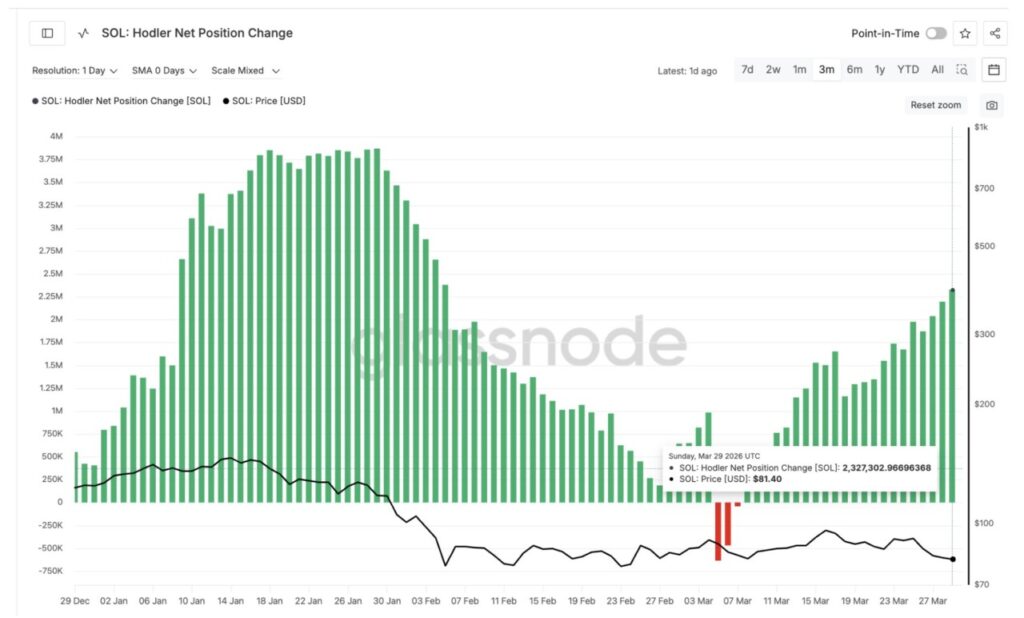
One metric that slightly held back the bearish scenario was the accumulation of long-term holders. The value of hodler net position change increased from 523,624 SOL on March 8 to 2,327,302 SOL on March 29, more than quadrupling. This suggests that mid- to long-term players are aggressively adding to their holdings, potentially creating a psychological floor for short-term holders considering selling.
However, the conviction of the hodlers remains noteworthy. When this group last started accumulating SOL in a big way in the period from January 10 to January 31, the SOL price dropped from $135 to around $105 in that time.
This means that their accumulation patterns have historically not always gone hand in hand with price recovery. As such, this metric is not yet strong enough to be a basis for optimism ahead of April.
If SOL outflows from the exchanges pick up again and spot demand recovers at the beginning of the month, hodler accumulation could help sustain the price recovery process. But without such confirmation, buying activity from this group alone may not be enough to derail the downside scenario towards the measured target.
Solana Price Levels to Watch in April
Solana’s most crucial price level for early April is $80. This area is in line with the short-term support zone. If the daily candle closes below $80, then the downside target of the head and shoulders pattern at $73 will become much more realistic, while opening up a full correction space of about 15% from the breakdown point.
The $73 level is also in line with the 1.618 Fibonacci retracement zone, thus reinforcing the validity of the area as a downside target.
On the upside, the first level that SOL needs to reclaim to build strength is $85, which coincides with the 0.618 Fibonacci level. After that, the next key line is at the 20-day EMA in the $86 area.
If SOL is able to rise convincingly above $86 again, this could trigger short-term bullish momentum and open the opportunity to test the top of the right shoulder around $93. If the price is able to stabilize above $93, the current bearish structure will weaken significantly.
For now, Solana’s main focus going into April is to hold above $80. Weakening demand on the exchanges, an improving but still fragile short-term holder position, and a confirmed breakdown of the head and shoulders pattern all suggest that the most likely direction is still to the downside.
As such, the price’s ability to hold consistently above $86 will be the difference between a recovery rally towards $93 or a continuation of weakness towards the breakdown target of $73.
Follow us on Google News to stay up to date with the latest in crypto and blockchain technology. Check Bitcoin price, usdt to idr and tokenized nvidia stock price through Pintu Market.
As a safe crypto app, Pintu provides a crypto trading experience to access crypto gold investment easily and conveniently. You can also see today’ s gold jewelry price and today’s gold bullion price to support your investment activities and portfolio diversification as well as learn crypto through Pintu Academy.
Download the Pintu crypto app via Play Store or App Store now. Enjoy web trading experience with advanced trading tools such as pro charting, various types of order types, and portfolio tracker only at Pintu Pro.
*Disclaimer
This content aims to enrich readers’ information. Pintu collects this information from various relevant sources and is not influenced by outside parties. Note that an asset’s past performance does not determine its projected future performance. Crypto trading activities are subject to high risk and volatility, always do your own research and use cold hard cash before investing. All activities of buying and selling Bitcoin and other crypto asset investments are the responsibility of the reader.
Reference:
- BeInCrypto. Solana Price Outlook: What To Expect From SOL In April 2026. Accessed on April 3, 2026
Latest News
© 2026 PT Pintu Kemana Saja. All Rights Reserved.
The trading of crypto assets is carried out by PT Pintu Kemana Saja, a licensed and regulated Digital Financial Asset Trader supervised by the Financial Services Authority (OJK), and a member of PT Central Finansial X (CFX) and PT Kliring Komoditi Indonesia (KKI). Crypto asset trading is a high-risk activity. PT Pintu Kemana Saja do not provide any investment and/or crypto asset product recommendations. Users are responsible for thoroughly understanding all aspects related to crypto asset trading (including associated risks) and the use of the application. All decisions related to crypto asset and/or crypto asset futures contract trading are made independently by the user.