3 Made-in-USA Crypto Emerging as Investor Focus in April 2026
Jakarta, Pintu News – The CLARITY Act discussion in the Senate Banking Committee could potentially enter a clearer phase in April. At the same time, three Made in USA crypto coins are approaching crucial technical points that could determine the direction of their movement throughout this month.
Analysts on the BeInCrypto website highlighted opportunities in three popular US coins, as regulatory clarity, on-chain fundamentals, and chart structure begin to converge at the same time. Each token is considered to offer a different risk profile ahead of April.
Stellar (XLM)
Stellar (XLM) enters April with a combination of fundamental catalysts and a technical structure that is considered the strongest of the two Made in USA coins on this list. The CLARITY Act discussion in April is considered to be a positive sentiment for Stellar, given that the network is known as a payment infrastructure compatible with ISO 20022 standards.
Read also: Hyperliquid Prices Ready to Rebound? HYPE Tests Important Support as Bullish Signals Strengthen
In addition, Franklin Templeton’s BENJI tokenization fund is still running on the Stellar network, while the value of real-world assets (RWA) in the ecosystem has surpassed $1.4 billion based on rwa.xyz data.
In terms of the daily chart (2/4), Stellar is seen forming an inverse head-and-shoulders pattern since late January. The neckline is around $0.190, and if a breakout occurs, the upside target is expected to be $0.234, or about 21.24% from that level.
The Relative Strength Index (RSI) indicator, which is used to measure the strength of momentum based on the speed of price changes, also supports this bullish scenario. In the period from January 25 to March 29, prices printed lower lows, but the RSI formed higher lows.
This bullish divergence is still considered active. Previously, when a similar pattern was confirmed around March 22, the price of Stellar recorded a surge of approximately 21%.
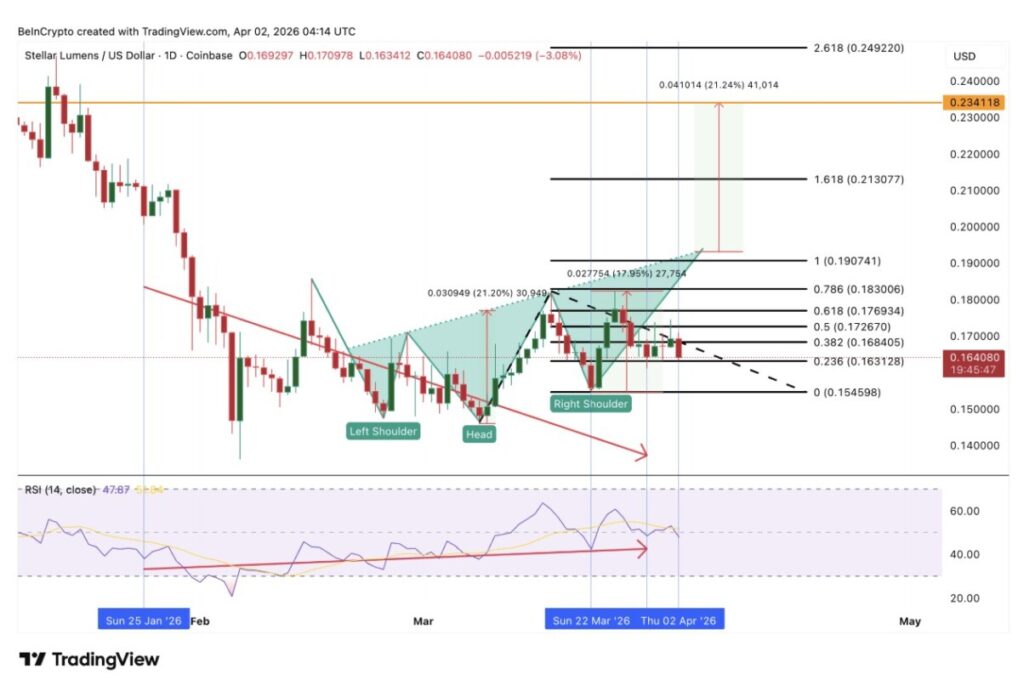
If the XLM price candle on April 3 closes above $0.163, then an additional bullish divergence layer will be confirmed. The initial resistance is in the $0.176 area, which is the 0.618 level. Conversely, if the price drops through $0.154, then the entire inverse head-and-shoulders structure will be invalidated.
In this context, the $0.163 level becomes an important boundary that distinguishes the chances of a continued rally towards $0.190 from the risk of structure failure if the price falls below $0.154.
Cardano (ADA)
Cardano (ADA) became the asset with the most bearish sentiment on this list, despite having one of the strongest April catalysts among Made in USA coins. The sentiment comes after Volatility Shares officially launched a 2x leveraged ETF and standard futures exposure for Cardano.
On the fundamental side, Midnight’s privacy sidechain has launched in the first quarter of 2026 with the support of validators such as Google Cloud, MoneyGram, and Vodafone. However, chart movements so far have not shown a positive response to these catalysts.
On the daily chart, ADA is seen forming a bearish triangle pattern with the lower trend line being around $0.2327. In the last 30 days, the price of ADA has dropped 13%, and in the most recent session it lost another 4.07%, bringing it closer to that support area with every candle formation.
Additional pressure came from the hidden bearish divergence. In the period from February 6 to April 1, the price formed a lower high, while the RSI printed a higher high. This pattern generally signals that the ongoing downtrend still remains dominant, despite the short-term momentum briefly showing improvement.
If the price drops through $0.232, then the next potential target area is $0.219, which is the base of the pattern’s measurement structure. Meanwhile, the initial recovery level is at $0.271. The sentiment will only turn bullish if ADA is able to move up consistently above $0.354, which is also the 0.618 level.
Read also: Will Pi Network Price Strengthen Ahead of April 6 Node Upgrade Deadline?
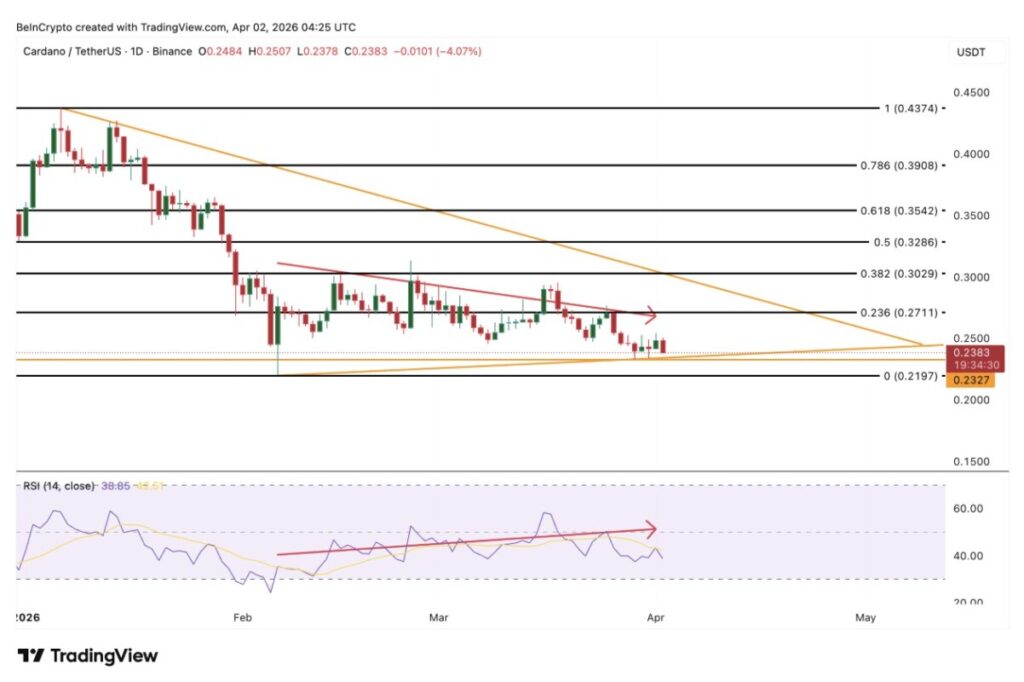
Until that happens, the development of the ETF and the launch of Midnight are just catalysts that have yet to be confirmed by the price chart. In the current technical view, the $0.232 level is an important boundary between the consolidation phase that is still stuck in a triangle pattern and a potential new decline towards the current year’s low of $0.219.
Algorand (ALGO)
Algorand (ALGO) was the token with the most dilemma among these three assets heading into April. Earlier in the year, Allbridge Core, a cross-chain bridge protocol that allows stablecoins to move between blockchain networks without wrapping, had opened up a native USDC transfer path to Algorand from Solana (SOL), Ethereum (ETH), Base, Sui (SUI), and Stellar.
This integration gives Algorand direct stablecoin access from five major ecosystems for the first time, while addressing one of the liquidity issues that has long plagued the network.
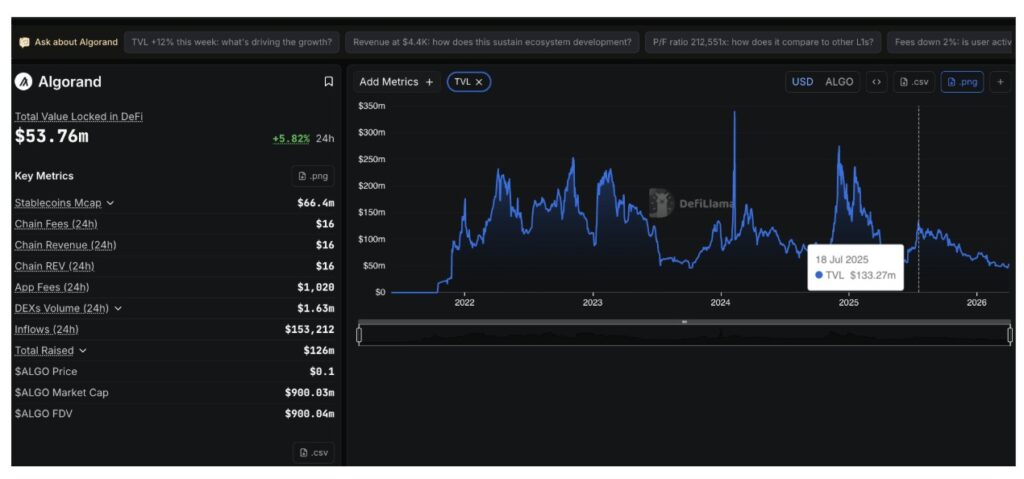
Even so, Algorand’s on-chain fundamentals actually show weakness. Based on DefiLlama data, the total value locked (TVL) of the DeFi sector in Algorand fell from $133.27 million in July 2025 to $53.76 million. This decline of around 60% contrasts with a monthly price increase of 15%, so there is a mismatch between price movements and the fundamental usage rate of the network.
On the daily chart (2/4), ALGO looks like it has the potential to form a bull flag and pole pattern, with a pole height of around 39%. However, it is currently in a pullback phase. In the span of January 5 to April 1 on the broader time frame, the price printed lower highs, while the RSI actually formed higher highs. This hidden bearish divergence pattern indicates that the upward momentum is starting to weaken and opens up opportunities for further correction.
ALGO’s direction throughout April is highly dependent on the price’s ability to hold the $0.095 level. If the daily close remains above this area, the bull flag structure is still considered valid and opens up the opportunity for an increase towards $0.104, and then continue to the full projection around $0.145.
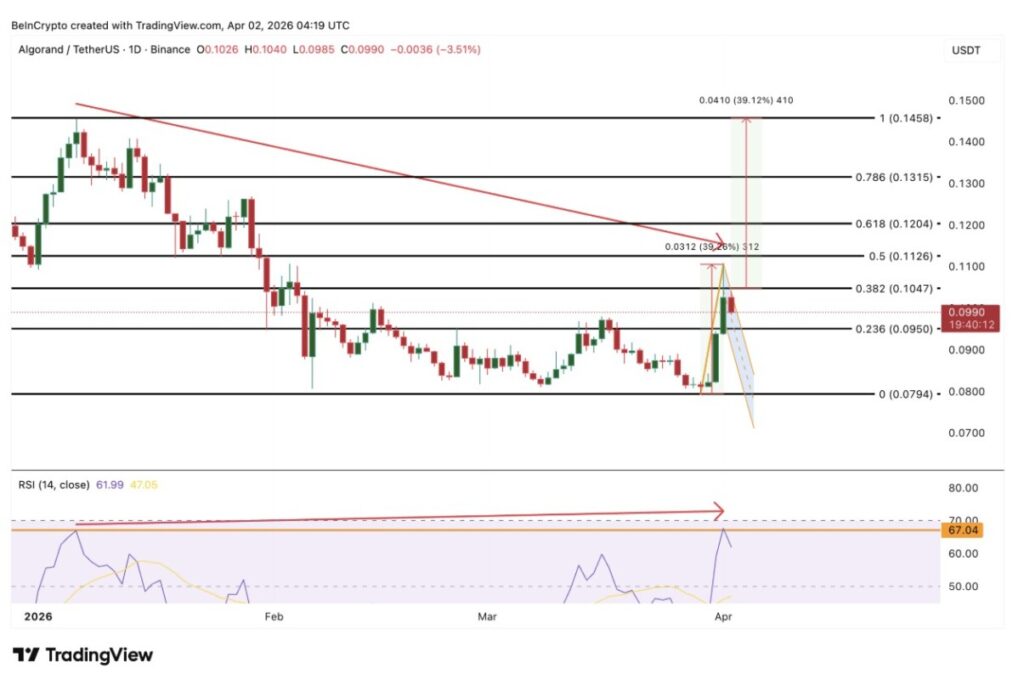
Conversely, if the price drops and breaks $0.095, then the bullish flag scenario will fall. It could also open the risk of a further drop to the $0.079 area.
For now, the $0.095 level is a very important boundary, as it separates the potential bull flag projection by 39% from the possible failure of the structure in line with the weakening fundamentals of DeFi Algorand.
Follow us on Google News to stay up to date with the latest in crypto and blockchain technology. Check Bitcoin price, usdt to idr and tokenized nvidia stock price through Pintu Market.
As a secure crypto app, Pintu provides a crypto trading experience to access crypto gold investment easily and conveniently. You can also see today’ s gold jewelry price and today’s gold bullion price to support your investment activities and portfolio diversification as well as learn crypto through Pintu Academy.
Download the Pintu crypto app via Play Store or App Store now. Enjoy the web trading experience with various advanced trading tools such as pro charting, various types of order types, and portfolio tracker only at Pintu Pro.
*Disclaimer
This content aims to enrich readers’ information. Pintu collects this information from various relevant sources and is not influenced by outside parties. Note that an asset’s past performance does not determine its projected future performance. Crypto trading activities are subject to high risk and volatility, always do your own research and use cold hard cash before investing. All activities of buying and selling Bitcoin and other crypto asset investments are the responsibility of the reader.
Reference:
- BeInCrypto. 3 Made In USA Coins To Watch In April 2026. Accessed on April 2, 2026
Latest News
© 2026 PT Pintu Kemana Saja. All Rights Reserved.
The trading of crypto assets is carried out by PT Pintu Kemana Saja, a licensed and regulated Digital Financial Asset Trader supervised by the Financial Services Authority (OJK), and a member of PT Central Finansial X (CFX) and PT Kliring Komoditi Indonesia (KKI). Crypto asset trading is a high-risk activity. PT Pintu Kemana Saja do not provide any investment and/or crypto asset product recommendations. Users are responsible for thoroughly understanding all aspects related to crypto asset trading (including associated risks) and the use of the application. All decisions related to crypto asset and/or crypto asset futures contract trading are made independently by the user.