World Oil Price Chart Today, Monday April 6, 2026
Jakarta, Pintu News – An important oil market metric that has often preceded major market crashes since 1987 is now approaching the danger zone.
Currently, the 12-month rate of change (ROC) of crude oil is at 91%. Analysts consider that every time this indicator breaks 100%, the market then experiences a sharp correction or crash.
World Oil Price Today
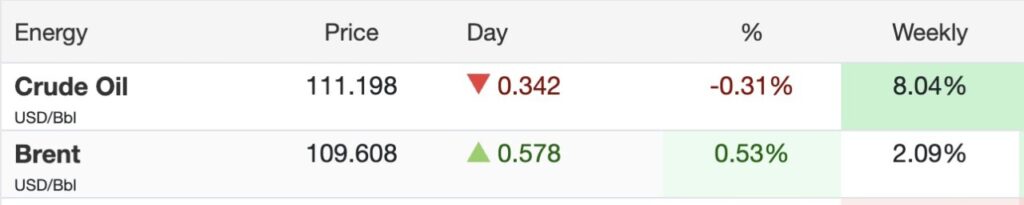
Based on today’s world oil price chart, the movement of energy prices shows different dynamics between crude oil and Brent. Crude oil was recorded at 111.198 USD per barrel. On a daily basis, this price decreased by 0.342 points or corrected by 0.31%.
Read also: Bitcoin Price Rises to $69,000 Today: Can BTC Surge Higher in April?
However, from a weekly perspective, crude oil still recorded a strong gain of 8.04%, indicating that the strengthening trend in recent days is still relatively dominant.
Meanwhile, Brent was trading at 109.608 USD per barrel. Unlike crude oil, Brent actually showed a daily increase of 0.578 points or 0.53%. However, its accumulated weekly gain is more limited at 2.09%. This shows that although Brent is still moving positively, the rate of strengthening is not as aggressive as crude oil.
Five Crashes, One Oil Movement Pattern
Analyst and trader Jack Prandelli highlights that this pattern has been repeated for almost four decades. In 1987, 1990, the bursting of the dot-com bubble, the 2008 financial crisis, and the 2022 bear market, oil’s 12-month ROC broke 100%.
With the current position at 91%, the remaining room is only about 9 points. This thin margin is considered to be quickly lost as supply shocks increase. Oil prices have been surging since the US-Israel attack on Iran began on February 28, triggering turmoil in the energy market and heightening fears of a recession.
Prandelli said that when oil prices move up this quickly, the economy usually starts to suffer. According to him, it is unlikely that this time will be different because history shows the same pattern.
Similarly, DataTrek Research co-founder Nick Colas previously noted that when oil prices double in a 12-month period, it can signal the onset of a recession.
Read also: Ethereum Price Rebounds to $2,100 Today: ETH Trendline Shows Uptrend Structure!
He explained that the rule of thumb he learned from the economics of the auto industry in the 1990s was: if oil prices jump 100% in a year, then a recession should be anticipated.
Meanwhile, supply disruptions that could potentially push oil prices over that threshold appear to have already begun. Tanker traffic in the Strait of Hormuz, which before the conflict carried around 20% of the world’s oil supply, has reportedly come to a halt.
US President Donald Trump also issued a new ultimatum. He threatened to attack Iranian infrastructure if the strait was not reopened before Tuesday. However, Iran insists that the waterway will remain closed until the issue of war reparations is resolved.
CVXON: Tokenization of Oil Company Shares
As blockchain technology develops, assets that were previously associated with traditional commodity markets are now starting to appear in digital format, including assets related to the energy sector and oil prices.
One relevant example in this context is Chevron (CVXON). As a global energy company, Chevron’s business activities span the entire value chain of the oil and gas industry, from upstream exploration and production to refining, distribution, marketing, transportation, petrochemicals and power development.
In the blockchain ecosystem, exposure to Chevron is now also available through CVXON (Chevron Tokenized Stock), a tokenized digital representation of Chevron Corporation shares issued by Ondo Finance. Through this asset, investors, especially outside the United States, can gain access to Chevron’s stock price movements.
Follow us on Google News to stay up to date with the latest in crypto and blockchain technology. Check Bitcoin price, usdt to idr and tokenized nvidia stock price via Pintu Market.
Enjoy an easy and secure crypto trading and crypto gold investment experience by downloading the Pintu crypto app via Play Store or App Store now. Also, experience web trading with advanced trading tools such as pro charting, various order types, and portfolio tracker only at Pintu Pro.
*Disclaimer
This content aims to enrich readers’ information. Pintu collects this information from various relevant sources and is not influenced by outside parties. Note that an asset’s past performance does not determine its projected future performance. Crypto trading activities are subject to high risk and volatility, always do your own research and use cold hard cash before investing. All activities of buying and selling Bitcoin and other crypto asset investments are the responsibility of the reader.
Reference:
- BeInCrypto. The Oil Signal That Preceded Major Market Crashes Since 1987 Is Flashing Again. Accessed on April 6, 2026
Latest News
© 2026 PT Pintu Kemana Saja. All Rights Reserved.
The trading of crypto assets is carried out by PT Pintu Kemana Saja, a licensed and regulated Digital Financial Asset Trader supervised by the Financial Services Authority (OJK), and a member of PT Central Finansial X (CFX) and PT Kliring Komoditi Indonesia (KKI). Crypto asset trading is a high-risk activity. PT Pintu Kemana Saja do not provide any investment and/or crypto asset product recommendations. Users are responsible for thoroughly understanding all aspects related to crypto asset trading (including associated risks) and the use of the application. All decisions related to crypto asset and/or crypto asset futures contract trading are made independently by the user.