Ethereum Holds Above $2,100 Today, but Where Could ETH Go Next?
Jakarta, Pintu News – Ethereum (ETH) price is at $2,181 on April 9, only about 0.5% above the crucial technical area, amid coordinated selling pressure from three sides.
The Ethereum Foundation, spot ETF holders, and whales alike are reducing their exposure simultaneously. At the same time, the two major moving averages on the daily chart are starting to approach each other and point to a potential bullish crossover. This combination of conditions puts Ethereum price in the most dilemmatic situation of April.
Then, how is Ethereum’s current price movement?
Ethereum Price Up 0.65% in 24 Hours
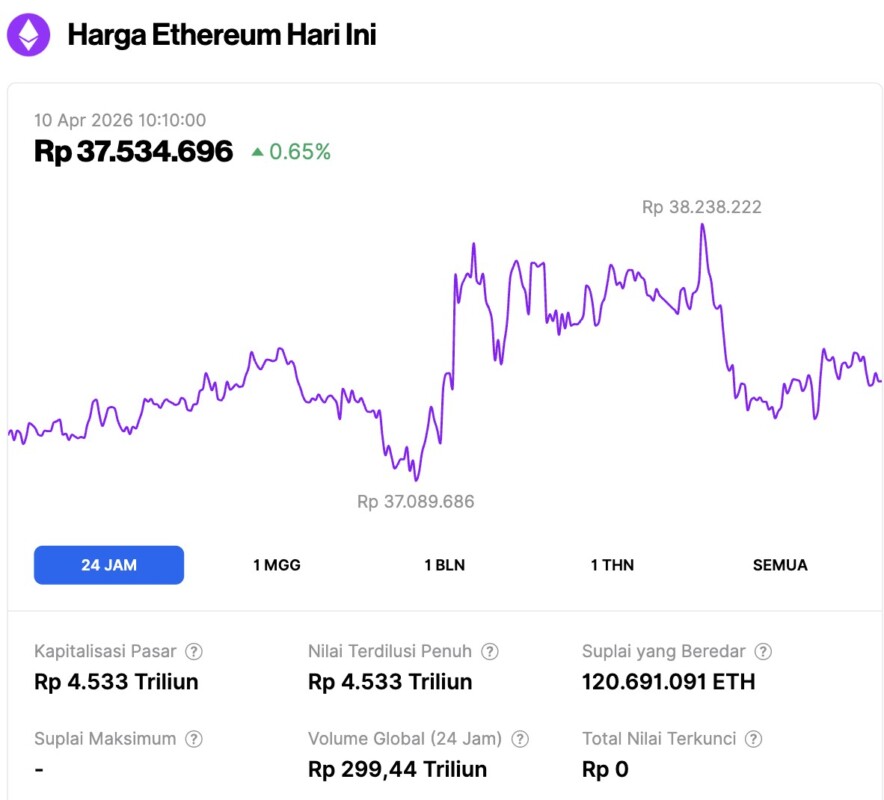
As of April 10, 2026, Ethereum was trading at around $2,188, or approximately IDR 37,534,696, marking a modest 0.65% gain over the past 24 hours. During that same period, ETH fell to a low of IDR 37,089,686 before climbing to a daily high of IDR 38,238,222.
At the time of writing, Ethereum’s market capitalization stood at roughly IDR 4,533 trillion, while its 24-hour trading volume declined by 10% to IDR 299.44 trillion.
Read also: Bitcoin Climbs to $71,000 Today — Here’s the Key Pattern Traders Need to Watch
Symmetrical Triangle Narrows as Two EMAs Move Closer Together
Ethereum price has been moving inside a symmetrical triangle pattern on the daily chart since late February. This pattern keeps the price movement sandwiched between a series of lower highs and higher lows, so the range of movement is getting narrower every session.
The latest test of the upper trendline saw another rejection. Sellers defended the area aggressively and pushed ETH back to the center of the triangle pattern. This rejection is important as it confirms that the pattern still remains valid and no breakout has occurred.
The 20-day Exponential Moving Average (EMA), a trend indicator that gives greater weight to recent price movements, stands at $2,114, still below the 50-day EMA at $2,151. The gap between the two is now narrowing. If the 20-day EMA manages to break above the 50-day EMA, it will form a golden cross and indicate a short-term shift in momentum in a bullish direction.
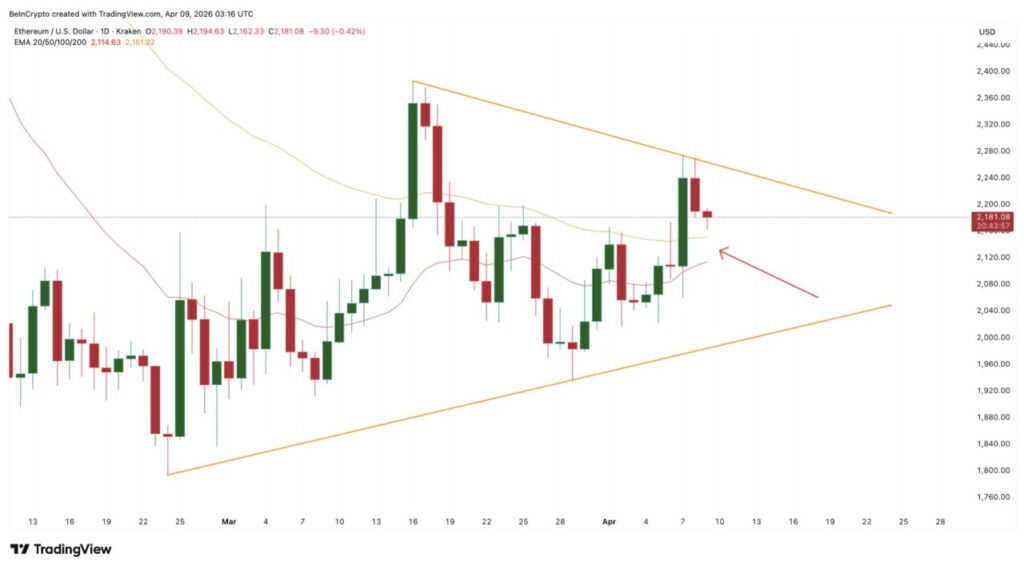
However, as selling pressure continues to increase from three sides, there is a risk that the 20-day EMA will be held and then move further down. A failed crossover attempt like this would only strengthen the bearish structure.
A failed crossover attempt inside a narrowing triangle pattern would increase the chances of a downward breakdown. However, charting alone is not enough to explain why ETH is under this much pressure. The selling pressure is not just technical, but also structural.
Foundation, ETF, and Compact Whale Reduce Exposure Simultaneously
Selling pressure is now coming from three different directions at almost the same time.
The Ethereum Foundation announced plans to convert 5,000 ETH into stablecoins via CoWSwap’s TWAP feature to fund research and development, grants, and donations.
Based on on-chain data from Lookonchain, a total of 3,750 ETH worth $8.3 million have been sold at an average price of $2.214. Meanwhile, another 1,250 ETH, worth around $2.77 million, are still earmarked for conversion. In its statement, the Foundation called this move part of routine cash management.
However, the market tends to interpret a large sale by the project’s founding entity as a bearish signal, regardless of its official purpose.
Read also: Whale Transactions Explode in Altcoins, Smart Money Aiming for Key Areas!
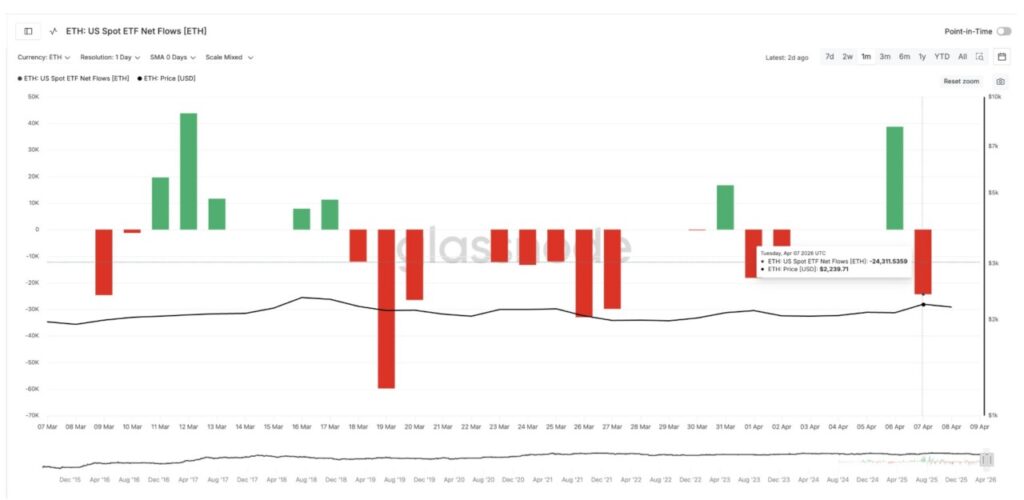
On the ETF side, the situation is also reversing rapidly. ETH spot ETF fund flows in the United States recorded a strong inflow of 38,769 ETH on April 6. However, a day later, on April 7, there was an outflow of 24,311 ETH. This reversal erased most of the institutional demand from the previous session in just one day.
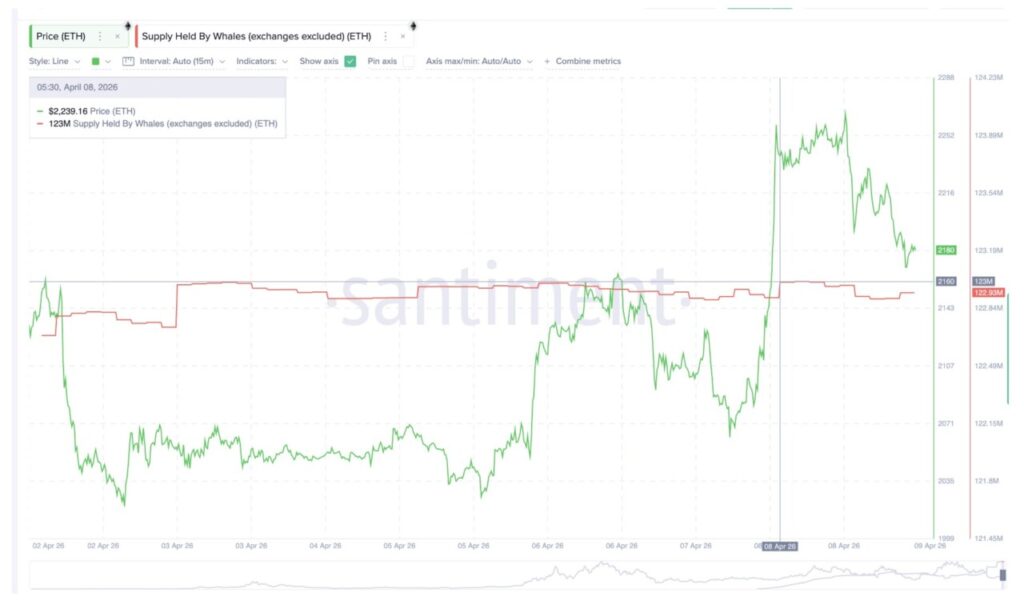
The movement of whales is the third layer of pressure.
According to Santiment data, the supply of ETH held by whales outside exchanges peaked at around 123 million ETH around April 8, and then dropped to 122.93 million ETH, equivalent to approximately $153 million. In nominal terms, this decline does appear limited.
However, the moment was an important factor. The whales started reducing holdings at about the same time as the Foundation started selling and ETF flows reversed.
When three independent groups, namely the Foundation, ETF holders, and whales, all decrease exposure within the same 48-hour window, the market faces an oversupply that is not easily absorbed by technical patterns alone. Ultimately, the ETH price chart will now determine how much pressure the market can withstand.
Ethereum Price is Only 0.5% Above the Level that Determines the Direction of Movement
ETH was trading at $2,181, only about 0.5% above the 0.236 Fibonacci level of $2,168. For now, that area is the most crucial level. If the daily close falls below $2,168, it will confirm that selling pressure from three directions has overpowered buying interest on the way down, while placing ETH clearly at the bottom area of the triangle pattern.
Below $2,168, the next support levels are at $2,102 at the 0.382 level and $2,049 at the 0.5 level. If the price drops again through $1,995 at the 0.618 level, the lower trend line of the symmetrical triangle pattern will become the main focus, so the risk of a breakdown towards $1,823 will increase.
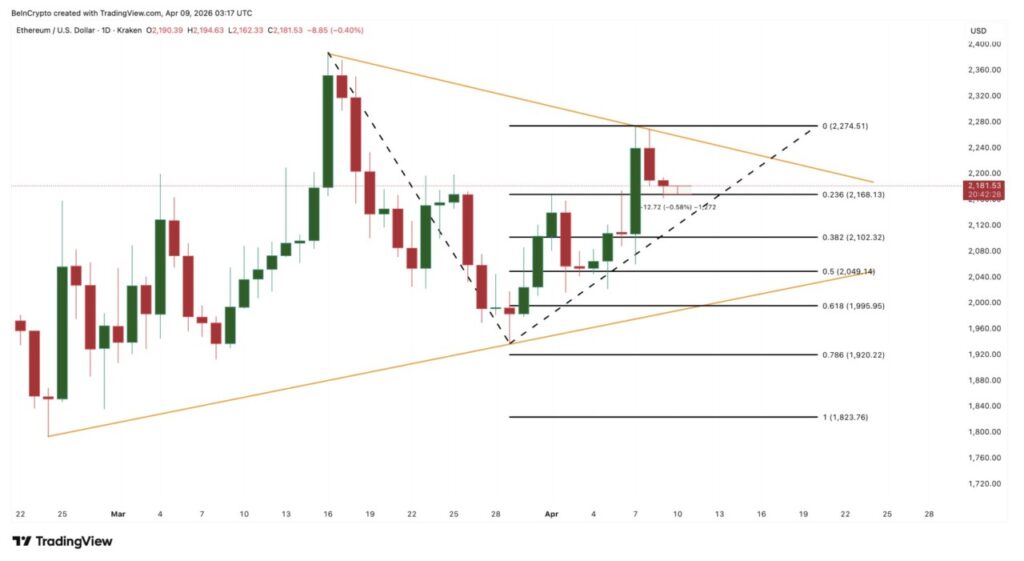
Ethereum’s price did dip below $2,168 in the trading session, but it later rebounded after receiving a buying push. This recovery shows that market participants are still paying attention to the area.
However, if there is a second test when the EMA golden cross is still not confirmed and the Ethereum Foundation still has 1,250 ETH left to sell, then this level may not hold as strongly as before. The generally weak market conditions also add to the pressure.
For the price strength to recover, ETH needs to hold above $2,168 and try to climb back to the $2,274 area. Such a move would bring the price close to the upper trendline and potentially help confirm the crossover. Even so, with three groups of sellers still active and no new demand catalysts in sight, the upside path remains a more difficult scenario.
Currently, the $2,168 level is the boundary that separates two possibilities: a support area that can still be maintained with a chance to rise back to $2,274, or a further decline due to selling pressure from three sides towards $2,102 and lower.
Follow us on Google News to stay up to date with the latest in crypto and blockchain technology. Check Bitcoin price, usdt to idr and tokenized nvidia stock price through Pintu Market.
As a safe crypto app, Pintu provides a crypto trading experience to access crypto gold investment easily and conveniently. You can also see today’ s gold jewelry price and today’s gold bullion price to support your investment activities and portfolio diversification as well as learn crypto through Pintu Academy.
Download the Pintu crypto app via Play Store or App Store now. Enjoy web trading experience with advanced trading tools such as pro charting, various types of order types, and portfolio tracker only at Pintu Pro.
*Disclaimer
This content aims to enrich readers’ information. Pintu collects this information from various relevant sources and is not influenced by outside parties. Note that an asset’s past performance does not determine its projected future performance. Crypto trading activities are subject to high risk and volatility, always do your own research and use cold hard cash before investing. All activities of buying and selling Bitcoin and other crypto asset investments are the responsibility of the reader.
Reference:
- BeInCrypto. Ethereum Price Clings to $2,168 as Foundation Leads a 3-Front Selloff. Accessed on April 10, 2026
Latest News
© 2026 PT Pintu Kemana Saja. All Rights Reserved.
The trading of crypto assets is carried out by PT Pintu Kemana Saja, a licensed and regulated Digital Financial Asset Trader supervised by the Financial Services Authority (OJK), and a member of PT Central Finansial X (CFX) and PT Kliring Komoditi Indonesia (KKI). Crypto asset trading is a high-risk activity. PT Pintu Kemana Saja do not provide any investment and/or crypto asset product recommendations. Users are responsible for thoroughly understanding all aspects related to crypto asset trading (including associated risks) and the use of the application. All decisions related to crypto asset and/or crypto asset futures contract trading are made independently by the user.