Market Analysis April 8th, 2024: BTC Faces Critical Resistance at $70,000

In the weeks leading up to the Bitcoin Halving, the price of Bitcoin has yet to see a revival. Instead, significant selling pressure occurred after crossing the $70,000 price level, leading to a drop by as much as 9%. Can Bitcoin rally to establish a new all-time high (ATH) prior to the halving? Check out the analysis below.
As usual, the Pintu trading team has gathered critical information and analyzed the general economic situation and the crypto market’s movements over the past week. However, it should be noted that all information in this Market Analysis is intended for educational purposes, not as financial advice.
Market Analysis Summary
- ⏰ The Bitcoin halving is expected on April 20, 2024, cutting the block reward from 6.25 BTC to 3.125 BTC.
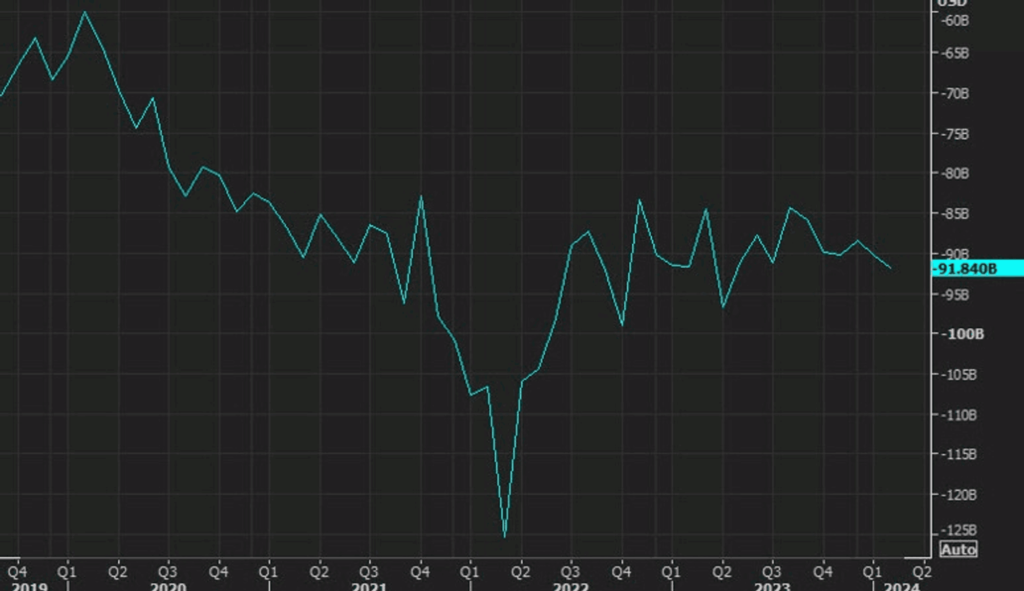
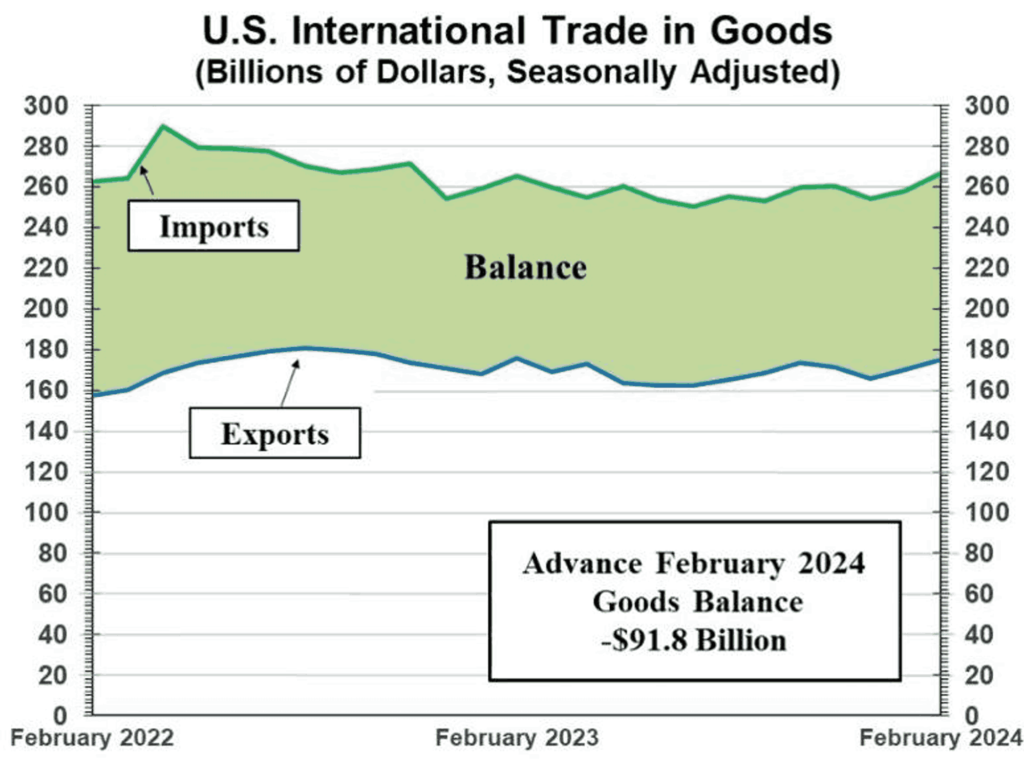
- 🏭 The U.S. capital goods trade balance reached -$91.84 billion, with exports rising to $175.1 billion and imports to $266.9 billion.
- 🟢 The Fed is expected to maintain current interest rates in its upcoming decision on May 1.
- 📈 Personal consumption expenditures increased significantly by 0.8% month-on-month.
- 💼 Initial Unemployment Claims rose by 221,000 from the previous week, while Continuing Unemployment Claims reached nearly 1.8 million.
Macroeconomic Analysis
Goods Trade Balance
In February, the US advance goods trade balance stood at -$91.84 billion, slightly lower than the previous month’s -$90.51 billion. Goods exports for February reached $175.1 billion, marking a $4.8 billion increase compared to January. Goods imports for the same period totaled $266.9 billion, reflecting a $6.1 billion rise from January. Overall, the uptick in trade is indicative of a positive trend for the US economy.
Other Economic Indicators
- Income and Spending: In February, personal income in the U.S. saw a modest increase of 0.3% from the previous month, a slowdown from January’s 1.0% growth and slightly below the anticipated 0.4%. After adjusting for inflation and taxes, real personal disposable income even slightly declined by 0.1%, after remaining stable in January. However, personal consumption expenditures significantly picked up, recording a 0.8% month-on-month increase, outperforming January’s modest 0.2% rise and exceeding expectations of a 0.5% increase. When adjusted for real terms, consumer spending increased by 0.4%, indicating a strong recovery from January’s 0.2% decrease. This rebound was driven by modest gains in goods spending (0.1%) and more substantial growth in services (0.6%).
- Core PCE: In February, the Personal Consumption Expenditures (PCE) price index, excluding food and energy (the Federal Reserve’s preferred measure of inflation), indicated a slowdown in inflation both monthly and yearly, increasing by 0.3% month-on-month and 2.8% year-on-year. The broader PCE index, including volatile food and energy costs, matched expectations with a 0.3% monthly rise and a 2.5% annual increase, suggesting stable inflation rates. This trend, likely to deter the Fed from reducing interest rates in the near term, is in line with forecasts. Market predictions point towards a steady stance in the upcoming May 1st decision. However, expectations for interest rate cuts are projected to begin at the June 11-12 meeting, aligning with the Federal Open Market Committee’s (FOMC) projections for three rate cuts this year, as indicated by futures market activity tracked by the CME Group’s FedWatch tool.
- Manufacturing Index: In March, the U.S. manufacturing sector signaled a return to expansion after 17 months of contraction. The Institute for Supply Management (ISM) manufacturing purchasing managers index (PMI) rose to 50.3 from February’s 47.8, exceeding expectations of 49.8. This resurgence in growth was echoed, though to a lesser extent, by the S&P Global US Manufacturing PMI™, which dipped slightly to 51.9 from 52.2 (falling below the forecast of 52.5). However, both indices indicated continued growth within the sector. The recovery in manufacturing aligns with broader economic strength observed in the first quarter, as evidenced by the fastest factory production growth since May 2022 and a rise in job creation. This period has also seen an increase in capital expenditure (capex) on machinery and equipment, reflecting firms’ renewed confidence in the economic outlook and an expansion of growth beyond the service sector to encompass manufacturing, driven by heightened demand for goods.
- Jolts Job Openings: According to the Job Openings and Labor Turnover Survey (JOLTS) released by the US Bureau of Labor Statistics (BLS) on Tuesday, the number of job openings on the final business day of February was reported at 8.75 million. This figure was slightly higher than January’s revised count of 8.74 million (initially reported as 8.86 million) and marginally exceeded the market expectation of 8.74 million.
- ADP Employment: According to the report released by Automatic Data Processing (ADP) on Wednesday, private sector employment in the US increased by 184,000 in March, with annual pay rising by 5.1% year-over-year. This uptick followed a revised increase of 155,000 (initially reported as 140,000) in February and surpassed the market’s expectation of 148,000. March was notable not only for the salary growth, but also for the sectors that experienced it. The most significant increases in job changes occurred in construction, financial services, and manufacturing. While inflation may be moderating, our data indicates that wages are increasing in both goods and services sectors.
- Global Service Index: On April 3, 2024, the U.S. services sector exhibited signs of cooling. The Institute for Supply Management (ISM) Services PMI for March slipped to 51.4 from 52.6 in February, falling short of expectations (52.7). This slowdown, attributed to fewer new orders, faster supplier deliveries, and a decline in employment, nevertheless indicates the sector’s continued expansion for most of the past 46 months. Similarly, the S&P Global Services PMI dipped slightly to 51.7 from 52.3, aligning with analyst forecasts. The composite index edged down to 52.2, matching expectations. These reports triggered a pullback in Treasury yields from their session peaks, though they remained near multi-month highs. The U.S. Dollar Index also dipped to session lows, suggesting that the weaker-than-anticipated performance in the services sector put pressure on the American currency, even amidst rising Treasury yields.
- Jobless Claims: A report released by the U.S. Department of Labor (DoL) on April 4, 2024, indicated an increase in unemployment claims. The number of applying for unemployment insurance benefits rose by 221,000 in the week ending March 30, exceeding both the initial estimate of 214,000 and the previous week’s increase of 212,000. The seasonally adjusted insured unemployment rate remained at 1.2%, and the four-week moving average climbed to 214,250, reflecting a 2,750 increase from the prior week’s revised average. Separately, Continuing Claims fell by 19,000 to 1.791 million in the week ending March 23.
BTC Price Analysis
Bitcoin Daily Chart Analysis Shows Price Rejection
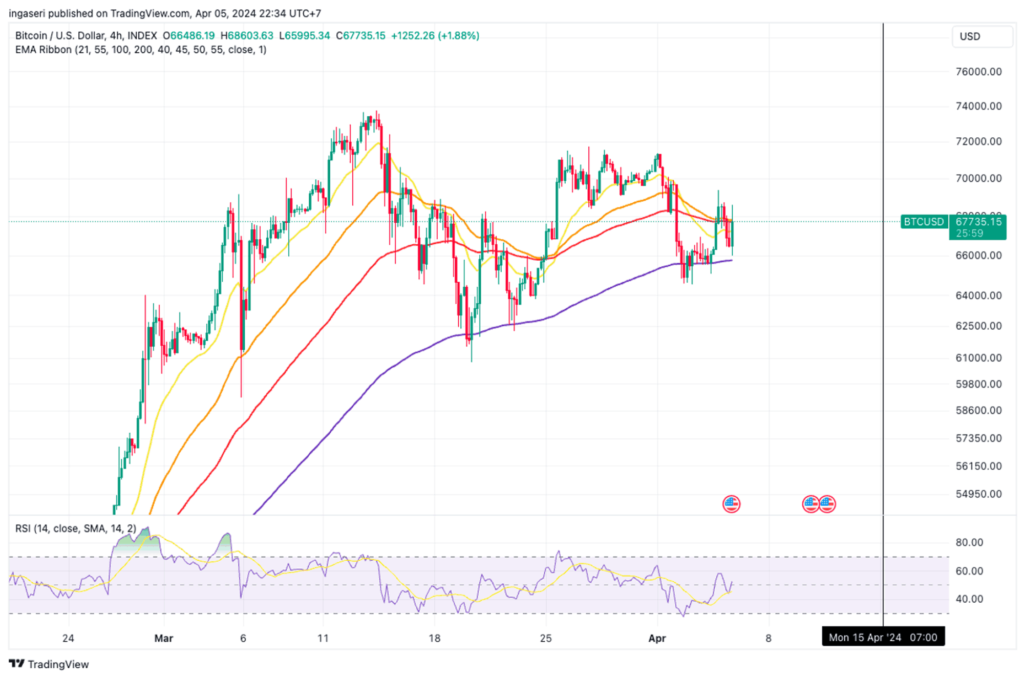
A comprehensive analysis of the daily chart indicates a significant increase in selling pressure on Bitcoin’s price subsequent to surpassing the crucial $70,000 resistance level, resulting in a notable rejection. This led to a 9% decline towards the pivotal $64,000 threshold.
There have been three Bitcoin halvings to date, the fourth halving is anticipated to take place on April 20, 2024. This event will reduce block rewards from 6.25 BTC to 3.125 BTC per block.
In contrast to previous halvings, this is the first instance where the BTC price is already at an all-time high. This raises questions about the potential implications for future trends. Will the cycle conclude earlier, or could this signify the onset of a super cycle instead?
The History of Bitcoin Halving
Before each halving event, Bitcoin’s price had never surpassed its previous all-time high. In 2012 the previous peak occurred 530 days before the initial halving, while the subsequent one was 105 days after it.
The second halving took place 920 days following the previous peak. Subsequently, it required 322 days for the BTC price to establish a new all-time high. The third halving occurred 890 days after the previous peak. Following this, it took the BTC price 225 days to reach a new peak.
The forthcoming halving is approximately 900 days after the previous all-time high. However, for the first time in Bitcoin’s history, an all-time high has been attained before the halving event.
Following the halving in 2016, the BTC price underwent a correction before subsequently resuming its steep upward trajectory towards a fresh all-time high.
On-Chain Analysis
- 📊 Exchange: As the exchange reserve continues to fall, it indicates lower selling pressure. Net deposits on exchanges are high compared to the 7-day average. Higher deposits can be interpreted as higher selling pressure.
- 💻 Miners: Miners’ are selling more holdings compared to its one-year average. Miner’s revenue is in a moderate range, compared to its one-year average.
- 🔗 On-Chain: More investors are selling at a profit. In the middle of a bull market, it can indicate a market top. Long term holders’ movement in the last 7days were higher than the average. If they were moved for the purpose of selling, it may have negative impact. Investors are in a belief phase where they are currently in a state of high unrealized profits.
- 🏦 Derivatives: Long-position traders are dominant and are willing to pay to short traders. Selling sentiment is dominant in the derivatives market. More sell orders are filled by takers. As open interest decreases, it indicates investors are closing futures positions and possibility of trend reversals. In turn, this might trigger the possibility of long/short-squeeze caused by sudden price movement or vice versa.
- 🔀 Technicals: RSI indicates a neutral condition. Stochastic indicates a neutral condition where the current price is in a moderate location between the highest-lowest range of the last 2 weeks.
News About Altcoins
- Solana Hit by High Transaction Failure Rate as Memecoin Mania and Bots Clog Network. Solana, the high-speed blockchain known for its rapid growth, is facing growing pains. A staggering 75% of non-voting transactions failed on the network on April 4th due to network congestion caused by surging trading volumes. This coincides with a surge in memecoin trading, often driven by bots that spam the network with arbitrage attempts. While Solana proponents see such congestion as inevitable growing pains, critics argue it exposes limitations in the network’s scalability claims.
News from the Crypto World in the Past Week
- US Government Moves $2 Billion Worth of Bitcoin, Raising Questions About Upcoming Sale. The US government, one of the biggest Bitcoin holders with over 200,000 BTC, recently transferred a significant amount of Bitcoin (over 30,000 BTC) worth approximately $2 billion. This activity comes amidst a recent slump in the crypto market and follows a January 2024 notice of forfeiture for the sale of 2,934 BTC seized from convicted criminals. The transfer to Coinbase, previously used by the government for asset sales, suggests the US may be preparing to offload some of its Bitcoin holdings, potentially further impacting the already volatile market.
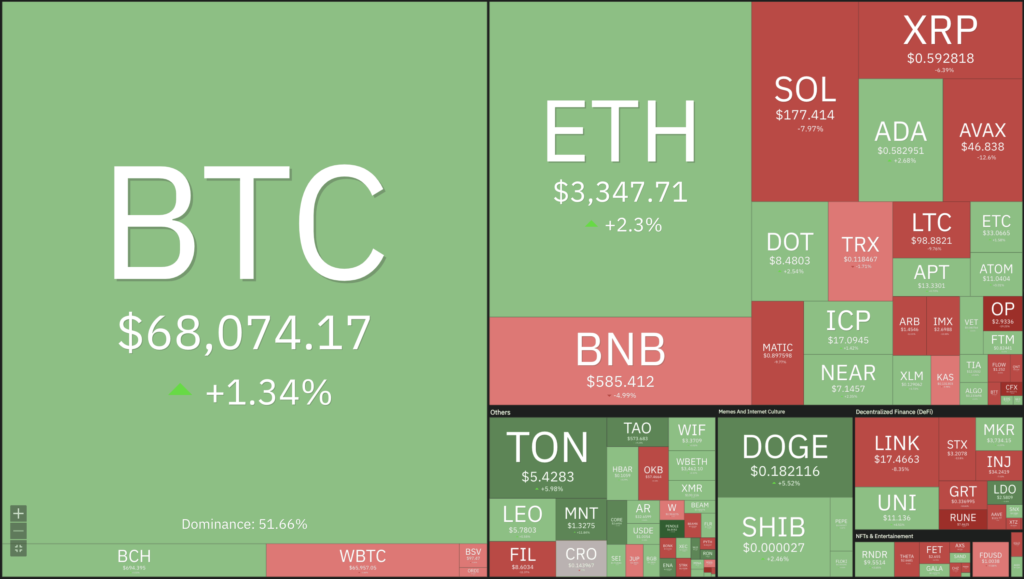
Cryptocurrencies Market Price Over the Past Week
Cryptocurrencies With the Best Performance
- Pendle +48,21%
- Ethena (ENA) +45,54%
- Bitcoin Cash +15,18%
- Toncoin +6,24%
Cryptocurrencies With the Worst Performance
- Wormhole (W) -30,97%
- Conflux Network (CFX) -25,37%
- dogwifhat (WIF) -25,29%
- Aptos -24,02%
References
- Unchainedcrypto, 75% of Solana Transactions Are Failing as Bots Dominate Swap Count, accessed on 6 April 2024.
- Grace Abidemi, Here’s Why the U.S. Government Made a $2B Bitcoin Transfer, dailycoin, accessed on 6 April 2024.
Share
Related Article


See Assets in This Article
BTC Price (24 Hours)
Market Capitalization
-
Global Volume (24 Hours)
-
Circulating Supply
-