Market Analysis Aug 21st 2023: Bitcoin Plummets 10% in Anticipation of Fed Rate Hike

The strong support for bitcoin at $28,500 has finally been breached, and BTC has plunged 10% in the past week. Several macroeconomic factors are behind the decline in BTC and other crypto assets. Currently, investors and traders need to be cautious in case there’s a potential for further declines. Read the full report below.
The Pintu trading team has gathered critical information and analyzed the general economic situation and the crypto market’s movements over the past week. However, it should be noted that all information in this Market Analysis is intended for educational purposes, not as financial advice.
Market Analysis Summary
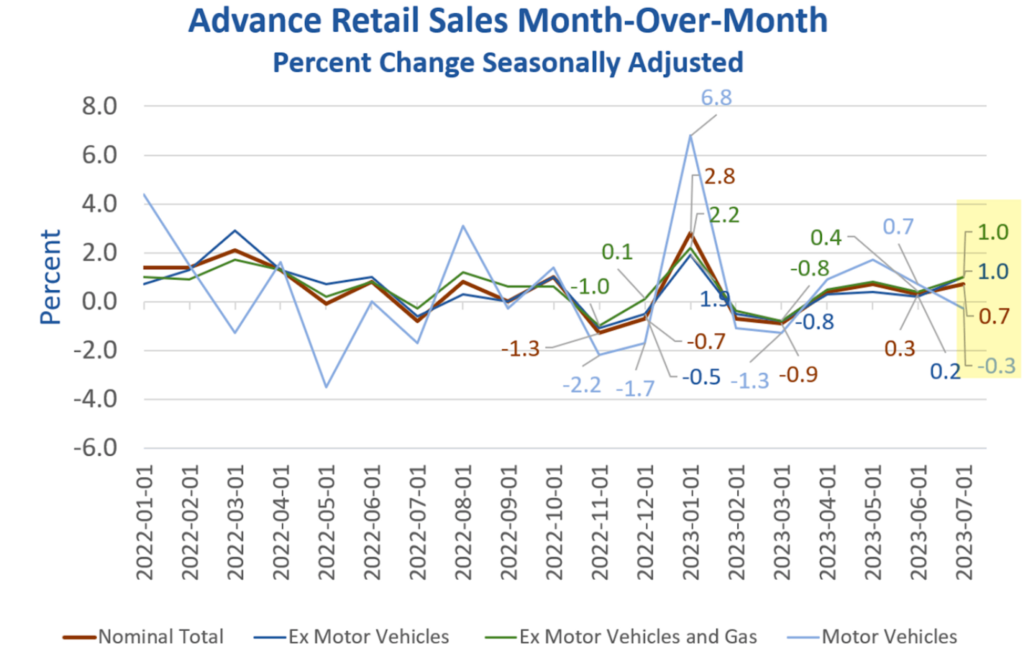
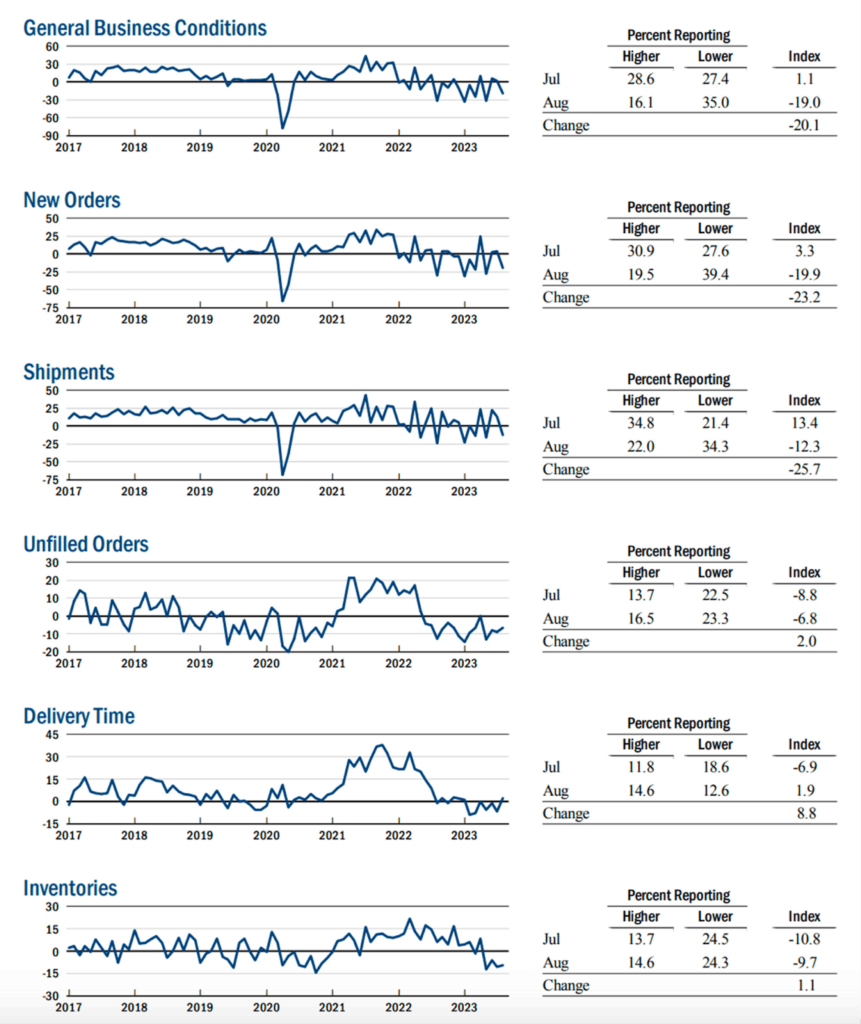
- 🔄 The Commerce Department reported that retail sales rose 0.7% in July. However, business activity in New York declined, with the main index of the Empire State Manufacturing Survey falling sharply.
- 🆘 Jerome Powell hinted at a possible rate hike at the September meeting. A majority of the FOMC members see inflation as a potential threat and consider raising interest rates as a solution.
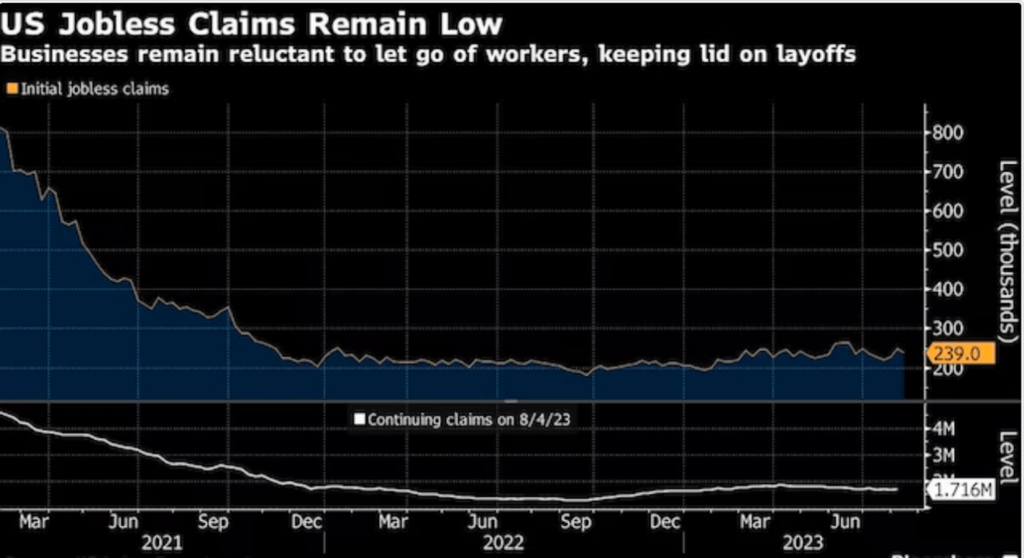
- 💪🏻 The U.S. labor market remains strong, with jobless claims declining despite signs of rising interest rates and inflation.
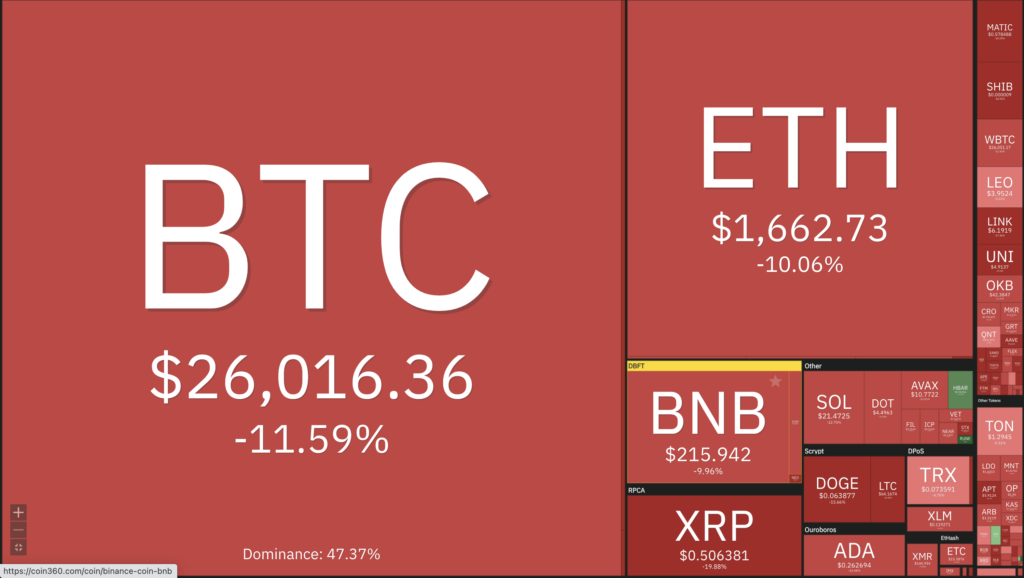
- ✍🏻 BTC and ETH have fallen over 8% on the back of Fed rate hike expectations, yuan devaluation concerns and speculation of a significant whale sell-off. The strongest support for BTC is currently at $25,800 and for ETH at $1,580.
Macroeconomic Analysis
The macroeconomic analysis began with positive data from the Commerce Department last Tuesday, which showed that retail sales rose 0.7% in July, beating market expectations of 0.4%. This increase reflected growth in a variety of sales sectors, including sporting goods stores, clothing stores, and even restaurants and bars.

Looking at the year-over-year (YoY) sales data for July, there were several increases:
- There was a 3.2% increase in sales, but excluding the automotive and gasoline categories, sales could be even higher at 5.3%.
- Retail sales at gas stations increased slightly by 0.4% in July, but are still down significantly by 20.8% year-on-year.
- Sales at bars and restaurants rose 1.4% in July, reflecting an 11.9% increase over the same period last year.
- Non-store retail and online sales showed a significant increase of 1.9% in July and a substantial increase of 10.3% year-on-year.
In addition to the increases, several sales sectors experienced declines in July, including:
- Sales of durable goods fell by 0.3% in the motor vehicle parts and dealers category, although they posted an annual gain of 7.6%.
- Furniture sales declined significantly by 1.8%, contributing to a 6.3% decline versus the prior year.
- Sales in electronics and appliance stores declined by 1.3% and were 3.1% lower than in the previous year.
These declines were received by firms participating in the August 20-23 Empire State Manufacturing Survey, which showed that business activity in upstate New York has indeed weakened. In fact, the main index reflecting general business conditions fell twenty points to -19.0, with both new orders and shipments showing significant declines.
Despite the decline in business activity, the labor market showed stable employment levels, albeit with slightly shorter average working days. Both input prices and selling prices were rising, and investment plans were increasing moderately. Looking ahead, firms were highly optimistic about the outlook for the next six months.

U.S. housing starts rose 3.9% in July to an annual rate of 1.45 million, in line with expectations, driven by an increase in single-family projects. Specifically, single-family construction surged 6.7% due to limited supply in the resale market.
The increase in housing construction naturally led to an increase in building permit applications, which also rose 0.1% to an annual rate of 1.44 million units. In fact, permits for single-family homes reached their highest level in a year.

In addition to the increase in housing, there are signs that Federal Reserve officials are reconsidering an interest rate hike. At the July 25-26 meeting of the Federal Open Market Committee (FOMC), a majority of members viewed inflation as a potential threat and were open to further rate increases to address this concern.
Investors are anticipating a possible pause in rate hikes next month, although the Federal Reserve’s future actions remain uncertain. Jerome Powell mentioned in July the possibility of another rate hike at the September meeting or holding rates at current levels.
In early July, the Federal Reserve raised its benchmark short-term interest rate by a quarter of a percentage point to a target range of 5.25% to 5.50%. This was the highest level in 22 years, following a pause in rate hikes in June.

Amid looming concerns about rising interest rates and inflation, the U.S. labor market continues to show its resilience as jobless claims fell by 11,000 to 239,000.
Looking at the four-week moving average of claims, which helps smooth out weekly fluctuations, claims increased by 2,750 to a total of 234,250.
Meanwhile, continuing claims, which indicate individuals seeking unemployment benefits on an ongoing basis, came in at 1.716 million for the week ending August 5th. This was slightly above the consensus estimate of 1.7 million and up from the previous reading of 1.684 million.
The continued strength in the labor market may be more than the Fed anticipated. Currently, the Fed is looking for signs of a slowdown in the labor market. Such a trend in the labor market could lead to lower demand for goods and services, which would support the central bank’s efforts to combat high inflation.
BTC & ETH Price Analysis
On August 18th, BTC plunged over 8% in just 10 minutes, and over the past week it has dropped nearly 10%. The first contributing factor to this decline is the release of the Fed’s minutes, which indicated an expectation of future rate hikes.
Another concern is the potential devaluation of the Chinese Yuan related to the Evergrande crisis and its bankruptcy filing in New York. Last week, the yuan traded at its lowest level since 2007. The last time China devalued the yuan in 2015, the price of bitcoin fell about -23% in the following two weeks. Following the devaluation, however, Bitcoin rebounded and ended the year in positive territory, up +59% from the devaluation point.
A third potential factor contributing to the decline is speculation of significant whale selling. Such moves can put additional pressure on the derivatives market, exacerbating BTC’s downward movement. BTC’s strongest support is currently at $25,800, with resistance at $27,200 and $28,000.

ETH also fell as much as 8% last week. Its current strongest support is at $1,580 and resistance is at $1,850.

Overall, the cryptocurrency market cap is nearing the $1 trillion threshold, which has historically served as a strong support level. If we break below this threshold, we can expect further downside.

On-Chain Analysis
- 📊 Exchange: As the exchange reserve continues to rise, it indicates higher selling pressure. Net deposits on exchanges are low compared to the 7-day average. Lower deposits can be interpreted as lower selling pressure.
- 💻 Miners: Miners’ are selling holdings in a moderate range compared to its one-year average. Miner’s revenue is in a moderate range, compared to its one-year average.
- 🔗 On-Chain: More investors are selling at a loss. In the middle of a bear market, it can indicate a market bottom. Long term holders’ movement in the last 7days were lower than the average. They have a motive to hold their coins. Investors are in a fear ****phase where they are currently with unrealized profits that are slightly more than losses.
- 🏦 Derivatives: Short position traders are dominant and are willing to pay long traders. Selling sentiment is dominant in the derivatives market. More sell orders are filled by takers. As open interest decreases, it indicates investors are closing futures positions and possibility of trend reversals. In turn, this might trigger the possibility of long/short-squeeze caused by sudden price movement or vice versa.
- 🔀 Technicals: Relative Strength Index (RSI) indicates a oversold condition where 71.00% of price movement in the last 2 weeks have been down and a trend reversal can occur. Stochastic level indicates a neutral condition where the current price is in a moderate location between the highest-lowest range of the last 2 weeks.
News About Altcoins
- OpenSea, a leading NFT platform, has announced that it will no longer support the creation of new listings and offers for NFTs on the BNB Smart Chain (BSC). This decision was made by OpenSea after evaluating the cost/impact ratio. However, users will still be able to view, discover and transfer BSC NFTs on OpenSea. OpenSea remains optimistic about a multi-chain future and has recently added support for L2s such as BuildOnBase and ourZORA.
- Sei Blockchain’s SEI Token Launch Hits $400 Million Market Cap Amid Airdrop Confusion and Trading Surge. High trading volumes were reported on major exchanges including Coinbase, Binance and Kraken. However, the rollout was marred by delays and confusion surrounding a promised airdrop of SEI tokens to early users and community members. The SEI team eventually clarified the airdrop process, but faced criticism and problems, including their Discord server going offline. Sei is built using the Cosmos SDK and aims to optimize speed and low fees for trading-focused applications.
News from the Crypto World in the Past Week
- Elon Musk’s company, SpaceX, has sold some of its bitcoin holdings. According to SpaceX’s financial statements for 2021 and 2022, the company had Bitcoin assets worth $373 million. Last week, some of those bitcoins were sold, causing the price of bitcoin to fall to $25,166, a 13.50% drop.
Cryptocurrencies Market Price Over the Past Week

Cryptocurrencies With the Best Performance
- THORChain (RUNE) +37.85%
- Hedera Hashgraph (HBAR) +12.98%
- Injective Protocol (INJ) +2.10%
- Tether +0.05%
Cryptocurrencies With the Worst Performance
- Litecoin (LTC) – 23.47%
- Uniswap -20.53%
- Xrp -19.70%
- The Sandbox -18.59%
References
- Micah Maidenberg, A Rare Look Into the Finances of Elon Musk’s Secretive SpaceX, Wsj, accessed on 19 Agustus 2023.
- Twitter, OpenSea BNB Smart Chain (BSC), accessed on 19 Agustus 2023.
- Sam Kessler, Sei, Blockchain Designed for Trading, Goes Live but ‘Frustration’ Mounts Over Airdrop, Coindesk, accessed on 19 Agustus 2023.
Share
Related Article
See Assets in This Article
2.9%
0.3%
0.0%
0.0%
1.9%
BTC Price (24 Hours)
Market Capitalization
-
Global Volume (24 Hours)
-
Circulating Supply
-


