Market Analysis Mar 18th, 2024: Bitcoin Faces Resistance at $75,000: Will $60k Be the Support?

After surging to new highs above $73,000, Bitcoin underwent a correction of more than 10% last Friday, briefly dipping below $65,000. This pullback was seemingly welcomed by investors waiting to buy at their target price. However, the correction has sparked speculation: will Bitcoin see a further decline before the halving event, or will it rebound back to the $73,000 level? Let’s explore the analysis below.
As usual, the Pintu trading team has gathered critical information and analyzed the general economic situation and the crypto market’s movements over the past week. However, it should be noted that all information in this Market Analysis is intended for educational purposes, not as financial advice.
Market Analysis Summary
- ✍🏻 Bitcoin faces resistance at the $75,000 level. The $60,000 level is emerging as crucial support that could mitigate the risk of a severe drop
- 👀 Despite signs of slowing economic activity in the United States, the Federal Reserve is not expected to consider an interest rate cut before June
- 💼 Initial state unemployment benefit claims decreased by 1,000 to 209,000. However, the number of continuing claims rose by 17,000 to 1.811 million
- 📈 The producer price index for final demand increased by 0.6% in February, following a 0.3% increase in January. Economists had anticipated a 0.3% rise
Macroeconomic Analysis
Unemployment Rate and Non-Farm Payrolls
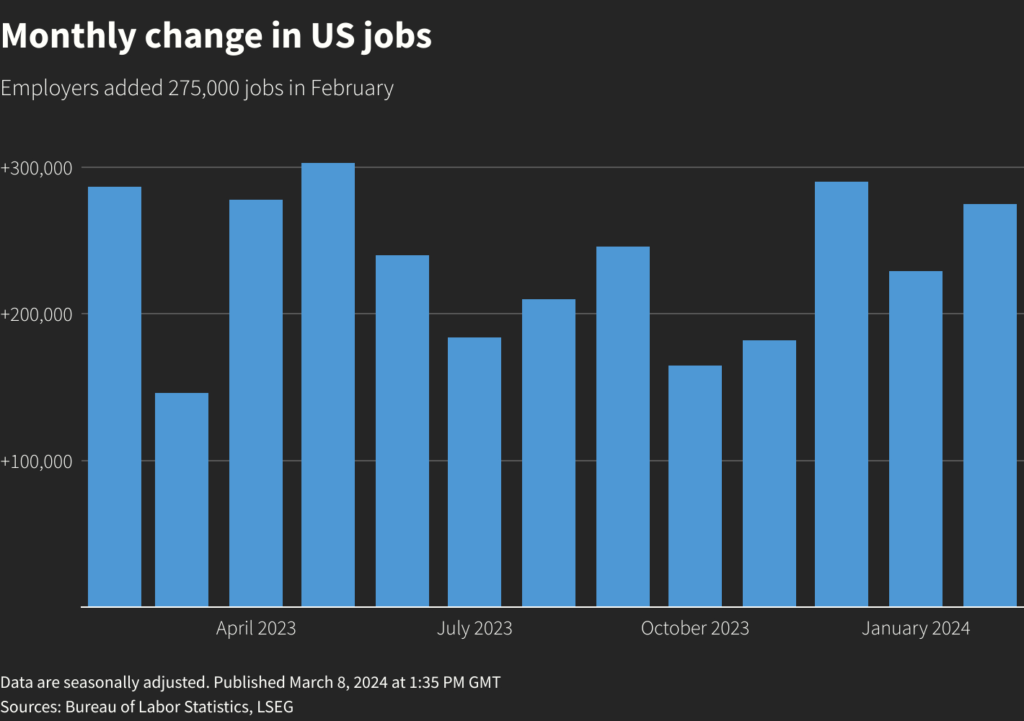
February US employment data showed higher-than-expected growth, with the addition of 275,000 jobs. The figure surpassed economists’ expectations of 200,000, signaling a recovery after downward revisions in December and January data. Behind this positive news, there were signs of a weakening labor market as the unemployment rate rose to 3.9%, the highest level in two years, partly due to a decline in labor force participation.
Before the reports were released, financial markets indicated an 80% probability of the first rate cut in June, up from 75%. Since March 2022, the US central bank has raised its policy rate by 525 basis points to the current range of 5.25% to 5.50%. Fed Chair Jerome Powell told lawmakers last week that a rate cut would likely be appropriate later in the year, but underscored their dependence on the trajectory of the economy. On Wall Street, stocks traded with gains, while the dollar weakened against a basket of currencies. US bond prices also showed mixed performance.
Other Economic Indicators
- Inflation Data: In February, inflation accelerated, presenting a concerning development for Fed officials who are seeking further progress in alleviating price pressures before considering any anticipated interest rate cuts. According to data released by the Bureau of Labor Statistics on Tuesday, the consumer price index increased by 3.2% year over year last month, surpassing the 3.1% pace set in January. Economists had anticipated that last month’s price growth would remain unchanged.
- Core Inflation: Core inflation, which excludes volatile food and energy prices, reached an annual pace of 3.8% for the month. While this rate is slightly lower than the 3.9% recorded in December and January, it is faster than what economists had expected. This figure represents a marginal decrease from the 3.9% rate documented in December and January, yet it surpasses the expectations of economists surveyed by FactSet. Core inflation was anticipated to decelerate to 3.7% year over year. On a monthly basis, core CPI registered a 0.4% increase. Economists had projected a moderation in the pace of core CPI inflation to 0.3% from the 0.4% reported in January.
- Retail Sales: February retail sales in the US rebounded, but the increase fell short of expectations. This suggests a potential slowdown in consumer spending during the first quarter, likely due to rising inflation and increased borrowing costs. Despite these signs of slowing economic activity, the Fed is not expected to consider a rate cut before June.
- Initial Jobless Claim: The US Department of Labor released a separate report on Thursday that showed a decrease of 1,000 in initial claims for the state unemployment benefits, bringing the total to 209,000. However, the number of continuing claims rose by 17,000 to 1.811 million. Significantly, the department also revised the level of ongoing claims over the past year.
- US Producer Price Index: Another report from the Labor Department indicated that the producer price index for final demand rose 0.6% in February, following a 0.3% increase in January. Economists had expected a 0.3% increase in the Producer Price Index. Almost two-thirds of the increase in the Producer Price Index was due to a 1.2% rise in goods prices, with wholesale gasoline prices rising 6.8% and food prices rising 1.0%. For the 12 months prior to February, the Producer Price Index rose 1.6% compared to a 1.0% increase in January. This report comes after Tuesday’s news that showed a strong rise in consumer prices for the second consecutive month in February.
BTC Price Analysis
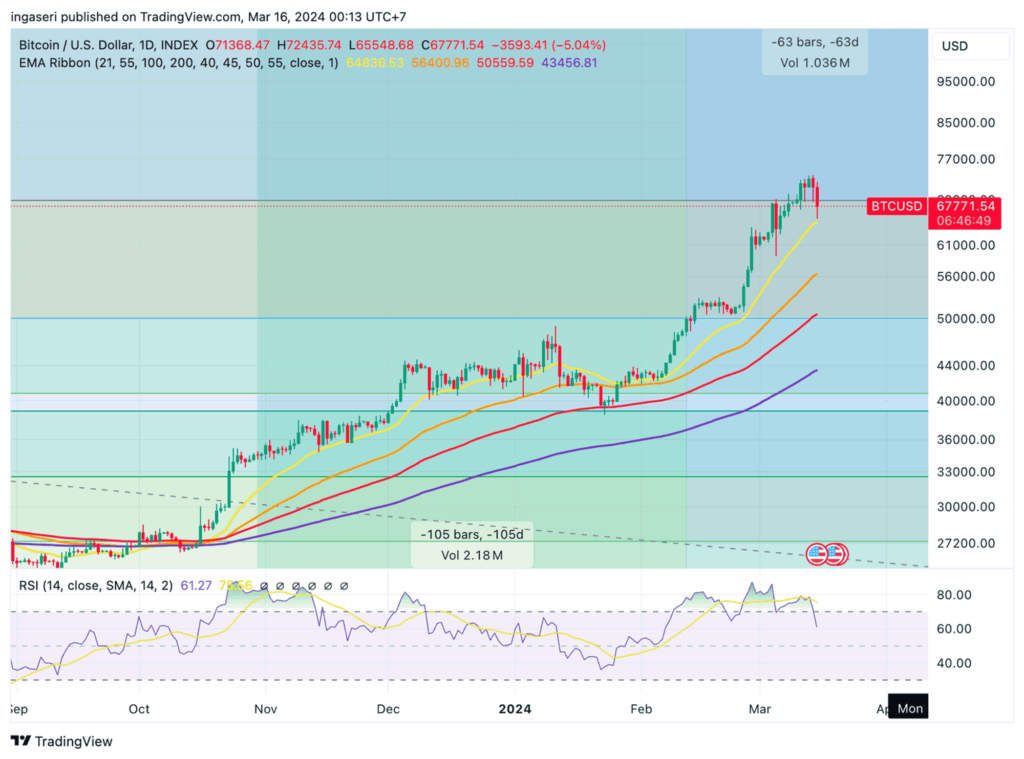
On March 14, BTC surged from a low of $72,571 to reach a new all-time high of $73,809 on Binance, marking a 1.35% increase. Simultaneously, the recently launched U.S. spot Bitcoin ETFs experienced a record-breaking influx of funds on March 12, amassing over $1 billion in inflows.
BlackRock’s Bitcoin ETF (IBIT) and Fidelity ETF (FBTC) remained in the spotlight on March 13, 2024, with combined inflows totaling approximately $870 million. During this period, institutional investments poured into the U.S. Bitcoin ETFs, totaling $700 million.
As the week drew to a close, BTC experienced a much-awaited correction following weeks of intense rallying. Recently, its price dipped by approximately 10%, prompting speculation among market participants about the possibility of a more substantial downturn.
Observing the daily chart reveals a consistent uptrend in price over the past few months, marked by successive higher highs and lows. However, Bitcoin faced resistance at the $75K level, leading to a retreat, with the market now slipping below the $68K support threshold. Nonetheless, there remains notable support around the $60K mark, potentially mitigating the risk of a severe crash.
In the midst of these developments, the Relative Strength Index has displayed evident bearish divergence of late, suggesting the likelihood of a more protracted correction phase in the market.
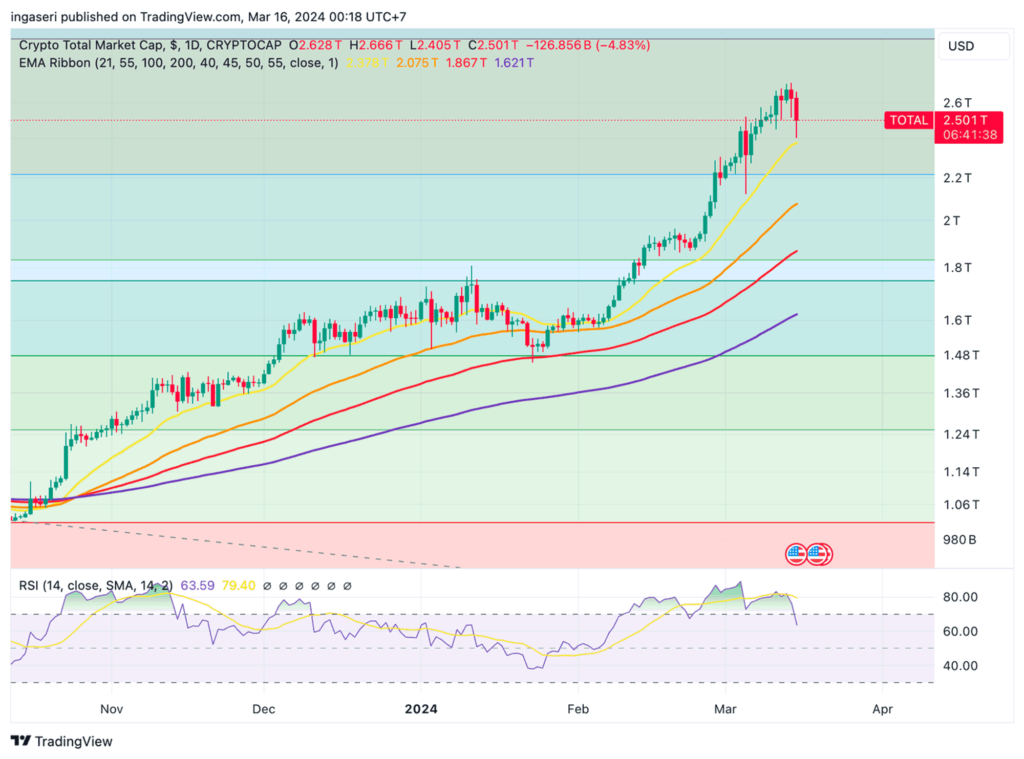
Total crypto market has risen 2.75% over the week to 2.6 Trillion dollars, only to trim to 2.5 Trillion at the end of the week.
Despite recent market volatility and the pressure to sell, bitcoin’s core technical indicators, notably the strong buy signals from the majority of Moving Averages, imply a resilient underlying strength. The ability of the market to maintain levels above crucial support thresholds, along with positive signals from long-term MAs, presents a favorable outlook for recovery and potential upward movement. Conversely, the recent downward movement, breaching support levels on the daily chart, accompanied by increased trading volume during declines, indicates a potential shift in market sentiment towards a bearish trajectory. The conflicting signals from oscillators, particularly the sell signals from the MACD indicator, alongside immediate downward pressure evident in the 4-hourly and hourly charts, suggest that the path of least resistance may be downwards.
On-Chain Analysis
- 📊 Exchange: As the exchange reserve continues to rise, it indicates higher selling pressure. Net deposits on exchanges are low compared to the 7-day average. Lower deposits can be interpreted as lower selling pressure.
- 💻 Miners: Miners’ are selling more holdings compared to its one-year average. Miner’s revenue is in a moderate range, compared to its one-year average.
- 🔗 On-Chain: More investors are selling at a profit. In the middle of a bull market, it can indicate a market top. Long-term holders’ movement in the last 7 days was higher than the average. If they were moved for selling, it may have a negative impact. Investors are in a belief phase where they are currently in a state of high unrealized profits.
- 🏦 Derivatives: Long-position traders are dominant and are willing to pay short traders. Buying sentiment is dominant in the derivatives market. Takers fill more buy orders. As open interest increases, it indicates more liquidity, volatility, and attention are coming into the derivative market. The increasing trend in open interest could support the current ongoing price trend.
- 🔀 Technicals: RSI indicates an overbought condition where 77.00% of price movement in the last 2 weeks has been up and a trend reversal can occur. Stochastic indicates an oversold condition where the current price is close to its high in the last 2 weeks and a trend reversal can occur.
News About Altcoins
- BOOK OF MEME (BOME) Token Rises 5000% In A Day! The launch of BOOK OF MEME (BOME), a new Solana-based meme coin, sent a jolt through the cryptocurrency market with a staggering 5,000% price increase in a single day. This meteoric rise, coupled with a 2,600% overall increase since launch, underscores the enduring popularity of meme coins like WIF, PEPE, and DOGE. BOME’s early success has even caught the eye of major crypto exchanges. However, while the meme coin market offers the potential for immense profit, investors must be aware of the inherent volatility and risks associated with these assets.
News from the Crypto World in the Past Week
- The recent Dencun upgrade to Ethereum has successfully reduced transaction fees on layer-2 solutions. These protocols compress and bundle transactions before sending them to the mainnet. The upgrade introduced Binary Large Objects (blobs) to store data more efficiently in large chunks off-chain, instead of relying on expensive, permanent on-chain storage. Since the implementation, average transaction fees have dropped significantly: Optimism went from $1.40 to 4 cents, Base from $1.50 to 3 cents, and Arbitrum to 40 cents. This allows rollups like Optimism, Arbitrum, and zkSync to store data more cost-effectively. While the Dencun upgrade is expected to reduce layer-2 transaction costs by up to 90%, there hasn’t been a corresponding increase in investor interest in the native tokens of rollups that benefit from blob-based transactions.
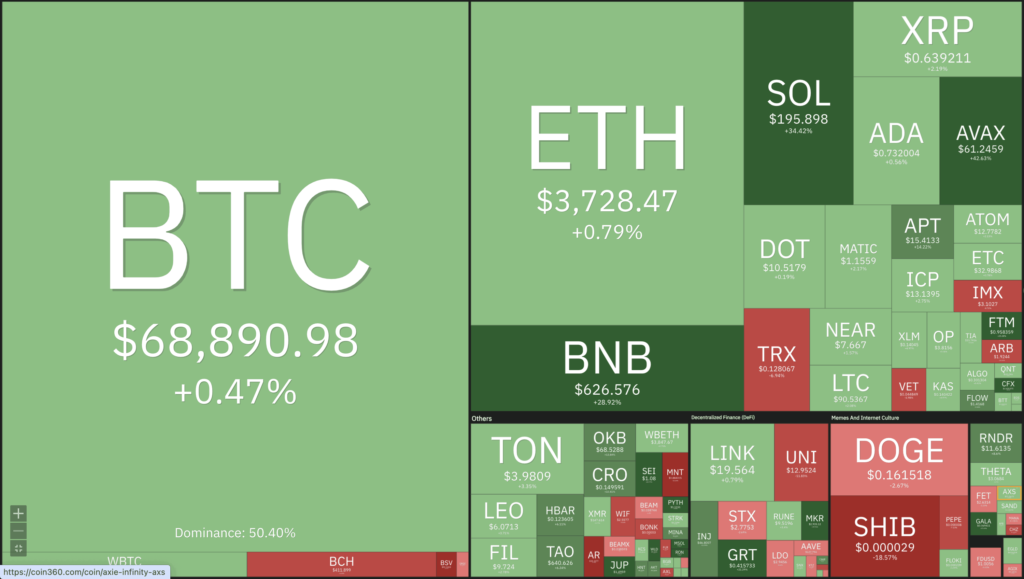
Cryptocurrencies Market Price Over the Past Week
Cryptocurrencies With the Best Performance
- BOOK OF MEME (BOME) +2087%
- 0x Protocol +139%
- Jupiter (JUP) +98%
- Pyth Network +60%
Cryptocurrencies With the Worst Performance
- Arweave -19,23%
- Optimism -16,10%
- Shiba Inu (SHIB) -15,70%
- SAST (1000SATS) -15,43%
References
- Olver Dale, Solana’s Latest Meme Coin BOOK OF MEME (BOME) Surges 5,000% in a Day, blockonomi, accessed on 16 March 2024.
- Omkar Godbole, Layer 2 Blockchains Become Cheaper After Ethereum’s Dencun Upgrade, coindesk, accessed on 16 March 2024.
Share
Related Article


See Assets in This Article
2.8%
0.0%
0.0%
0.0%
0.0%
BTC Price (24 Hours)
Market Capitalization
-
Global Volume (24 Hours)
-
Circulating Supply
-