Market Analysis Feb 19th, 2024: Bitcoin poised to test crucial resistance level after surpassing $52,000

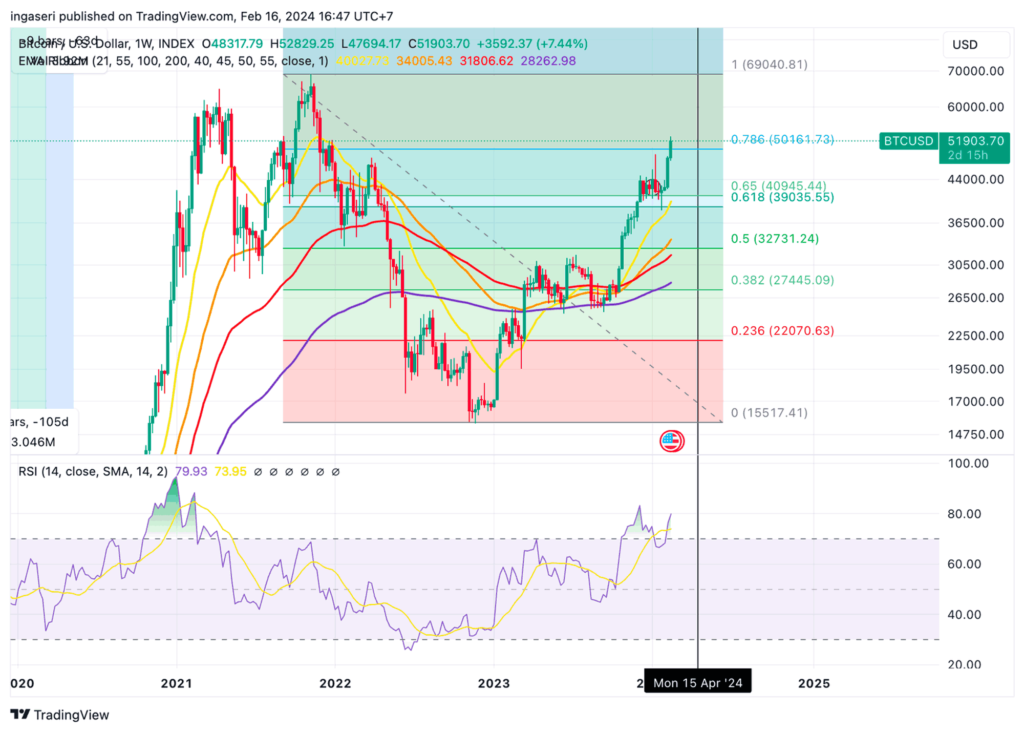
Bitcoin defied expectations by breaking the $50,000 resistance level, marking its highest price point since 2022. This breakthrough presents two potential scenarios: If BTC can sustain its momentum and climb above $53,000, it could trigger further upward movement. However, if BTC fails to hold above $50,000, it could return to the $46,500 support level. Which scenario will BTC encounter? Check out the analysis below.
As usual, the Pintu trading team has gathered critical information and analyzed the general economic situation and the crypto market’s movements over the past week. However, it should be noted that all information in this Market Analysis is intended for educational purposes, not as financial advice.
Market Analysis Summary
- ✍🏻 BTC went above the $52,000 threshold. The immediate resistance is situated around the $52,450 mark.
- 📉 The consumer price index indicates that the annual inflation rate decreased to 3.1% in January from December’s 3.4%. Consumer spending notably decreased in January, marking the most substantial monthly pullback since March.
- 🏪 Retail sales contracted by 0.8% during the month, following a downwardly revised 0.4% gain in December.
- 💼 For the week ending Feb. 10, applications for unemployment benefits dropped by 8,000 to 212,000, according to Thursday’s report from the Labor Department.
Macroeconomic Analysis
Consumer Price Index
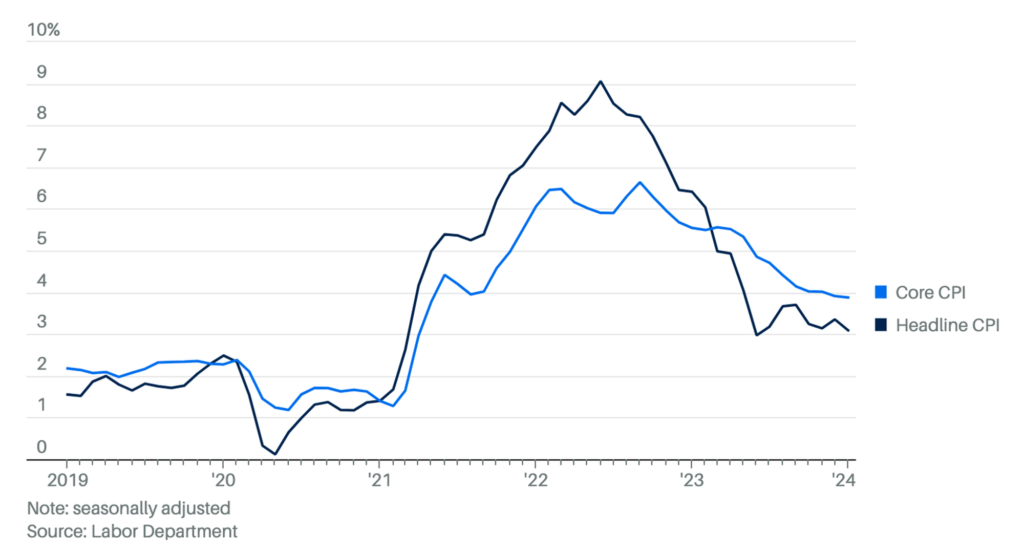
Inflation in January showed a slight decline, falling to 3.1%, but still exceeding the Federal Reserve’s target of 2%. Core inflation remained steady at 3.9%. While this represents a decrease from the pandemic peak, some categories, like shelter and food, saw price increases in January.
It’s worth noting that inflation has significantly dropped from its June 2022 peak of 9.1%, where average consumer income couldn’t keep pace, leading to negative real incomes for over two years. However, this trend has reversed, with average hourly earnings rising 1.4% from January 2023 to January 2024 (US Department of Labor). Notably, since May 2023, workers’ hourly wages have outpaced inflation, boosting purchasing power.
Other Economic Indicators
- Retail Sales: Consumer spending fell sharply in January, marking the largest monthly decline since March and raising concerns about the health of the U.S. economy. Retail sales fell 0.8%, more than the expected 0.3% decline after a revised 0.4% increase in December. The decline was larger than expected as sales excluding autos also fell 0.6% versus expectations for a 0.2% gain. Although the sales report is seasonally adjusted, it does not account for inflation, suggesting that spending is not keeping pace with price increases, with year-over-year sales growth of only 0.6%.
- Initial Jobless Claims: Initial jobless claims for the week ending February 10 fell to 212,000, indicating minimal layoffs. Although slightly higher than the prior week’s 212,750, the four-week average remains low at 218,500. This resilience comes even though the Fed has raised interest rates 11 times since March 2022 to combat inflation, which is still above the 2% target. Although the economy has not entered the expected recession, the Fed has held rates steady in recent meetings, indicating a cautious approach to further tightening.
- NY Empire State Manufacturing Index: The February index showed a slight improvement in manufacturing activity in New York State, with the General Business Conditions Diffusion Index rising to -2.4 from -43.7 in January, beating expectations of -13.7. While indicating a contraction in activity (as readings below 0.0 indicate worsening conditions), this improvement suggests a significant moderation in the contraction observed last month. Based on a survey of approximately 200 manufacturers in New York State, the index serves as a barometer of the overall health of the state’s manufacturing sector.
BTC Price Analysis
After a surge beyond the $50,000 resistance, the price of BTC experienced a correction to the downside, testing the $48,250 zone before initiating a new upward movement.
The bulls successfully propelled BTC above the $52,000 threshold. The immediate resistance is around the $52,450 mark, with the subsequent resistance at approximately $53,200. Achieving a conclusive close beyond the $53,200 level could initiate another sustained upswing.
In such a scenario, the price may ascend toward the $55,000 level, and further gains could propel Bitcoin toward the $56,200 level in the short term. Examining the chart below, it is necessary to establish strong support at the 0.786 Fibonacci retracement line, situated at the $50,000 support level, before advancing further to the upside.
However, if this doesn’t materialize, a downside correction might commence. Immediate support can be identified around the $50,800 zone, followed by a significant support level at $50,000 or the prevailing trend line. Any additional losses could steer the price toward the $49,200 support zone. The subsequent crucial support is positioned near the $48,800 level, and a breach of this level increases the risk of a decline toward the $46,500 level in the forthcoming days.
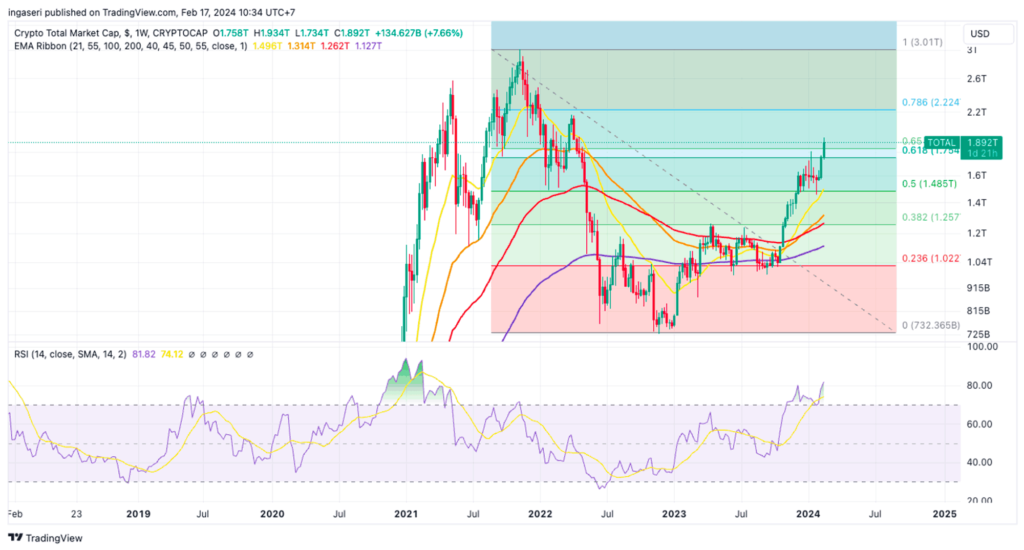
The weekly total crypto market chart indicates the formation of support at the lower boundary of the Fibonacci golden ratio area. Anticipate a continued upward movement in the crypto market; anticipate robust support at the 1.75 trillion USD market cap in the absence of this development.
On-Chain Analysis
- 📊 Exchange: As the exchange reserve continues to fall, it indicates lower selling pressure. Net deposits on exchanges are high compared to the 7-day average. Higher deposits can be interpreted as higher selling pressure.
- 💻 Miners: Miners’ are selling holdings in a moderate range compared to its one-year average. Miner’s revenue is in a moderate range, compared to its one-year average.
- 🔗 On-Chain: More investors are selling at a profit. It can indicate a market top in the middle of a bull market. Long-term holders’ movement in the last 7 days was lower than the average. They have a motive to hold their coins. Investors are in a belief phase where they are currently in a state of high unrealized profits.
- 🏦 Derivatives: Long-position traders are dominant and are willing to pay to short traders. Selling sentiment is dominant in the derivatives market. More sell orders are filled by takers. As open interest increases, it indicates more liquidity, volatility, and attention are coming into the derivative market. The increasing trend in open interest could support the current ongoing price trend.
- 🔀 Technicals: RSI indicates an overbought condition where 92.00% of price movement in the last 2 weeks have been up and a trend reversal can occur. Stochastic indicates a neutral condition where the current price is in a moderate location between the highest-lowest range of the last 2 weeks.
News About Altcoins
- Worldcoin (WLD) reached a new all-time high. The price of WLD reached $5.36 within a week and achieved a market capitalization of approximately $700 million. Backed by Tools of Humanity, founded by Sam Altman, CEO of OpenAI, Worldcoin’s value soared following the launch of Sora, an artificial intelligence (AI) model capable of converting text into video. The token has historically been sensitive to news related to OpenAI, notably experiencing a drop in November 2023 following Altman’s brief departure from the company. The overall AI token market has also seen a notable surge, with a 25% increase over the past week, highlighting the growing interest in AI-related cryptocurrencies amid a slightly improved market.
News from the Crypto World in the Past Week
- ETFs Drive Bitcoin’s Rise to $1 Trillion Market Capitalization. Bitcoin’s recent surge past the $50,000 mark, reaching a market capitalization of $1 trillion, was significantly driven by an influx of new investments from Bitcoin exchange-traded funds (ETFs), with approximately 75% of new funds excluding Grayscale’s GBTC coming from these ETFs, according to CryptoQuant. This investment trend coincides with an increase in Bitcoin’s realized capitalization to $454 billion, indicating strong demand ahead of Bitcoin’s anticipated halving in April. With $9.5 billion or 2% of total historical investment in Bitcoin, channeled through ETFs, these inflows underscore the important role spot Bitcoin ETFs play in current market dynamics, highlighting a bullish medium-term outlook but also posing potential risks if ETF-driven demand wanes.
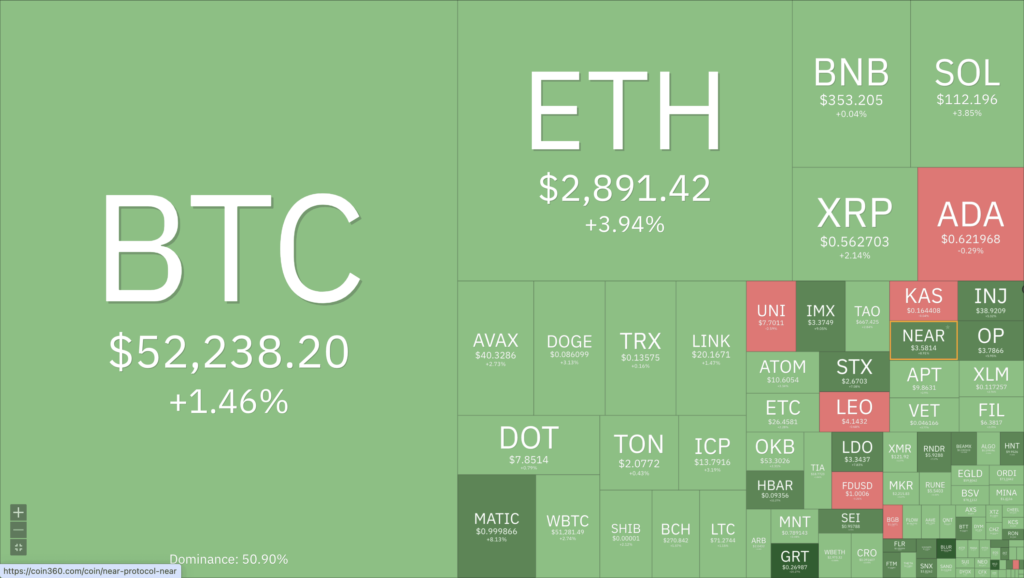
Cryptocurrencies Market Price Over the Past Week
Cryptocurrencies With the Best Performance
- Worldcoin +152,13%
- The Graph +61,43%
- VeChain +51,57%
- Sei (SEI) +43,78%
Cryptocurrencies With the Worst Performance
- Astar (ASTR) -5,78%
- Celestia (TIA) -1,99%
- Bitcoin Cas -0,62$
References
- Mandy Williams, Is BTC’s Price Impacted by the Recently-Approved Spot Bitcoin ETFs? (CryptoQuant Analysis), cryptopotato, accessed on 18 Februari 2024.
- Tim Copeland, Worldcoin price sets all-time high on back of Sora AI launch, up 100% in a week, theblock, accessed on 18 Februari 2024.
Share
Related Article


See Assets in This Article
BTC Price (24 Hours)
Market Capitalization
-
Global Volume (24 Hours)
-
Circulating Supply
-