Market Analysis Dec 11th, 2023: BTC Poised for $48,000 Surge

Bitcoin continues on a positive trajectory, having breached the crucial $40,000 resistance level last week. While a correction is always possible, several factors suggest BTC may continue its surge toward $48,000. Read the full analysis below.
As usual, the Pintu trading team has gathered critical information and analyzed the general economic situation and the crypto market’s movements over the past week. However, it should be noted that all information in this Market Analysis is intended for educational purposes, not as financial advice.
Market Analysis Summary
- 🏭 The S&P Global US Manufacturing PMI™ fell to 49.4 in November from 50.0 in October, indicating a return to deteriorating operating conditions and a return to contractionary territory.
- 💼 US job openings fell to a 2.5-year low of 8.73 million in October. The Fed will be watching this closely before deciding on interest rate policy.
- 🚨 Continuing jobless claims in the US fell sharply in November by 64,000 to 1.86 million. The data points to a slowdown in job creation, an increase in unemployment, and a loss of momentum in wage growth.
- 👀 BTC is currently approaching a critical resistance zone marked by the key $45,000 area. If BTC can break through this level, it could potentially trigger a rally toward the $48,000 resistance level.
- 🚀 There is a significant potential for the ETH to reach the $3,000 mark in the next phase if the ETH investors continue to be aggressive.
Macroeconomic Analysis
S&P Global Manufacturing and Services Index
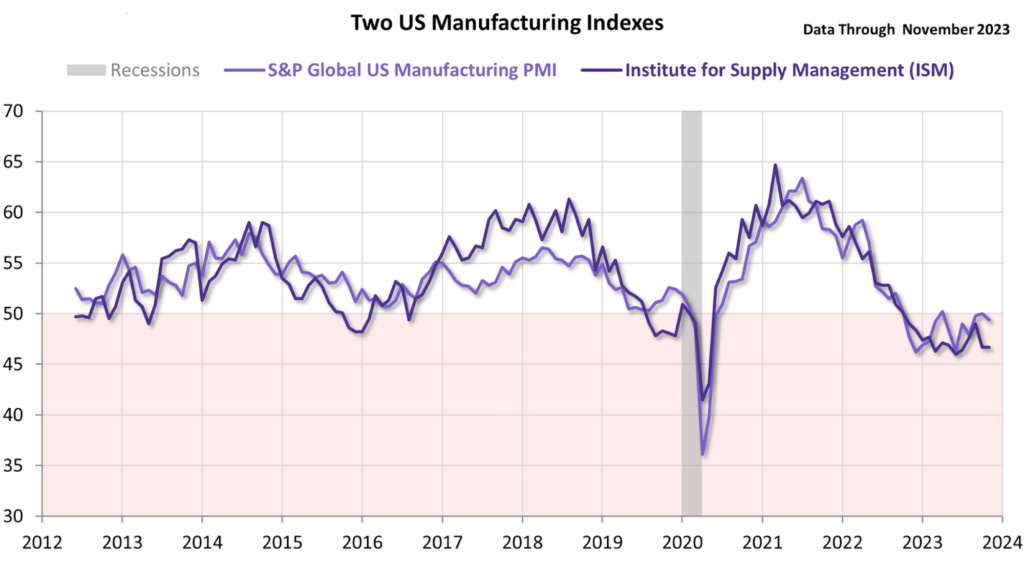
The S&P Global US Manufacturing PMI™ fell to 49.4 in November from 50.0 in October, marking a return to declining operating conditions and a return to contraction territory after one month of expansion.
US manufacturers faced challenges with relatively minimal output growth and a decline in work flows, suggesting a limited contribution from the goods-producing sector to US fourth-quarter gross domestic product (GDP). Despite some optimistic signs with the beginning of changes in the inventory cycle, US producers remain focused on cutting costs, including downsizing, reflecting two consecutive months of declining payrolls.
A decline in employment could adversely affect consumer spending and weaken wage bargaining power. However, easing wage pressures and cooling commodity cost inflation have led to a decline in average factory selling price inflation, contributing to a future decline in consumer price inflation.
The Institute for Supply Management’s (ISM) Manufacturing Purchasing Managers’ Index (PMI) held steady at 46.7 in November, marking the 13th consecutive month in contraction territory after 29 months of growth.
Other Economic Indicators
- Jolts Job Openings: Job openings in the US have reached a 2.5-year low, with 8.73 million in October, significantly down from the expected 9.4 million. The ratio of job openings to available workers falling to 1.3 to 1, closer to pre-pandemic levels. While total hiring saw a slight decrease, and the number of workers quitting remained relatively unchanged, layoffs and separations experienced a minor increase. The Fed is closely monitoring this trend as it decides on the next steps for interest rate policy.
- Automatic Data Processing (ADP) Employment Change: US private sector job growth slowed in November, adding only 103,000 jobs, well below the Dow Jones expectation of 128,000. Wage growth was also the slowest in more than two years, rising at an annual rate of just 5.6%. The leisure and hospitality sectors lost jobs, while the trade and services sectors added jobs. There were job losses in goods-producing industries, including manufacturing and construction. These data do not reflect layoffs in the technology and financial sectors, as both continue to show job growth.
- Initial Jobless Claims: Continuing jobless claims in the US fell sharply in November, falling by 64,000 to 1.86 million. Despite this decline, claims remain high and point to a slowing labor market with factors such as slowing job creation, rising unemployment, and slowing wage growth. Initial claims rose slightly to 220,000 in December, while November’s employment report is expected to show an increase in hiring, leading the Federal Reserve to likely keep interest rates steady.
BTC & ETH Price Analysis
BTC
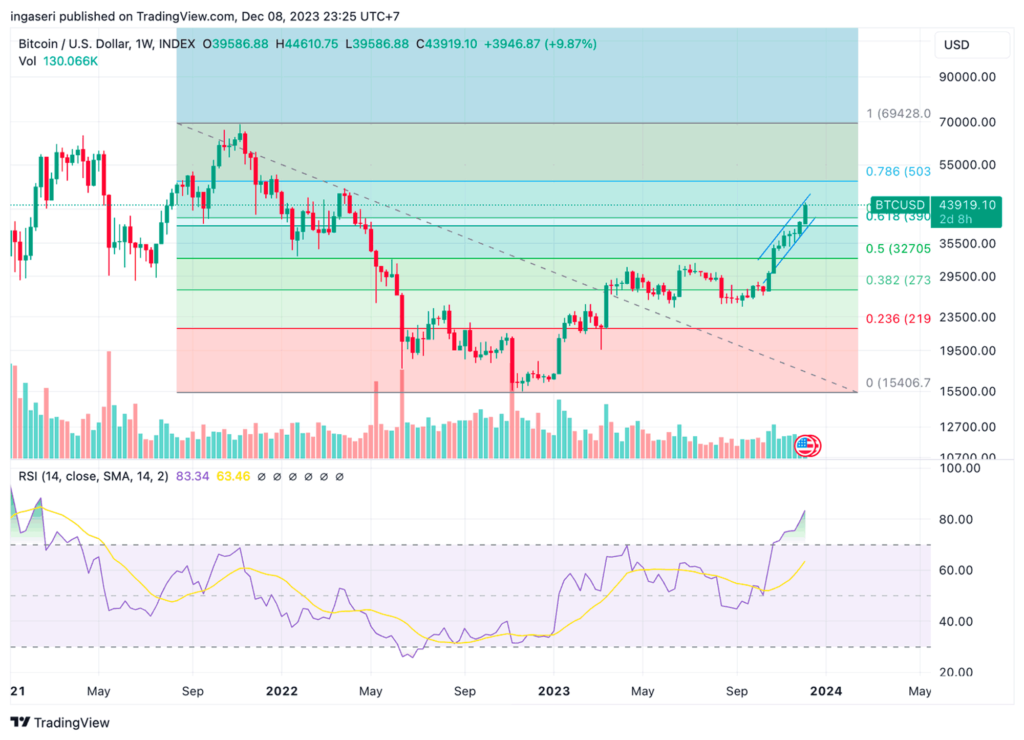
Over the week, BTC has cleared off the $40,000 mark, gaining almost 10% week-on-week.
Historically, the $40,000 resistance has presented a significant hurdle for Bitcoin, and its breach indicates a noteworthy presence of buyers.
However, the price has now reached a critical resistance zone, characterized by the crucial $45,000 region and the upper boundary of a multi-month ascending channel. This range acts as a pivotal barrier for Bitcoin buyers, and a successful breach of this level could trigger another rapid surge towards the resistance zone at $48,000. As a result, the market is likely to undergo a phase of consolidation correction before determining its next directional move.
ETH
ETH experienced a 7% surge in price over the week, breaking out of the Fibonacci golden ratio.
The rally commenced with a breakout above $2,150, and there might not be a substantial pullback until it reaches $2,500, which is the current target for this upward movement. Should buyers maintain their aggressive stance, there’s potential for ETH to reach $3,000 in the subsequent phase.
Moving forward, the momentum is bullish, and ETH is indicating signs that it could regain some of the ground it lost to Bitcoin in the preceding weeks.

On-Chain Analysis
- 📊 Exchange: As the exchange reserve continues to fall, it indicates lower selling pressure. Net deposits on exchanges are high compared to the 7-day average. Higher deposits can be interpreted as higher selling pressure.
- 💻 Miners: Miners’ are selling holdings in a moderate range compared to their one-year average. Miner’s revenue is in a moderate range, compared to its one-year average.
- 🔗 On-Chain: More investors are selling at a profit. In the middle of a bull market, it can indicate a market top. Long-term holders’ movement in the last 7 days was lower than the average. They have a motive to hold their coins. Investors are in a belief phase where they are currently in a state of high unrealized profits.
- 🏦 Derivatives: Long-position traders are dominant and are willing to pay short traders. Selling sentiment is dominant in the derivatives market. More sell orders are filled by takers. As OI increases, it indicates more liquidity, volatility, and attention are coming into the derivative market. The increasing trend in OI could support the current ongoing price trend.
- 🔀 Technicals: RSI indicates an overbought condition where 89.00% of price movement in the last 2 weeks has been up and a trend reversal can occur. Stochastic indicates a neutral ****condition where the current price is in a moderate location between the highest-lowest range of the last 2 weeks.
News About Altcoins
- Solana DeFi Users Celebrate a $225 Million Jito Airdrop. Jito, a Solana-based DeFi platform, has distributed 90 million JTO tokens worth $225 million to eligible users. This airdrop favors users holding smaller amounts of JitoSOL, sparking debate among larger holders, or whales. This airdrop follows the $77 million Pyth Network airdrop and precedes the upcoming Jupiter airdrop to nearly one million users.
News from the Crypto World in the Past Week
- BlackRock and Bitwise update Spot Bitcoin ETF filing, fueling speculation of potential SEC approval. BlackRock and Bitwise have made additions regarding efforts to monitor price movements and comply with anti-money laundering regulations. Although the SEC has not yet approved a spot bitcoin ETF, analysts believe these updates could indicate that discussions are underway. The news comes amid a 20.6% surge in bitcoin prices over the past month, sparking speculation that the SEC may finally be ready to greenlight a spot ETF.
Cryptocurrencies Market Price Over the Past Week

Cryptocurrencies With the Best Performance
- Ordinals +136,85%
- Cardano +46,47%
- Avalance +44,87%
- Beam (BEAM) +39,38%
Cryptocurrencies With the Worst Performance
- Kaspa (KAS) -5,94%
- Maker (MKR) -5,38%
- Toncoin (TON) 3,39%
- Aave -0,77%
References
- Sander Lutz, Jito Airdrop Hands Out $225 Million to Solana Users, decrypt, accessed on 9 December 2023.
- Anna Baydakova, BlackRock, Bitwise file updated spot bitcoin ETF applications with the SEC, theblock, accessed on 9 December 2023.
Share
Related Article


See Assets in This Article
BTC Price (24 Hours)
Market Capitalization
-
Global Volume (24 Hours)
-
Circulating Supply
-