Market Analysis Feb 26h, 2024: Potential short-term correction for BTC

The price movement of Bitcoin after touching the price of $53,000 had created a very optimistic market. However, as we approach the end of February, BTC has struggled to reclaim this level, largely hovering between $51,000 and $52,000. Will this bullish momentum continue in the next few weeks? Check out the analysis below.
As usual, the Pintu trading team has gathered critical information and analyzed the general economic situation and the crypto market’s movements over the past week. However, it should be noted that all information in this Market Analysis is intended for educational purposes, not as financial advice.
Market Analysis Summary
- ✍🏻 The Bitcoin market is facing challenges around the $51,000-52,000 level.
- 👀 Ethereum investors prepare for the March 13 Ethereum Dencun and explore the Layer2 platform within the ETH ecosystem.
- 📊 The January Producer Price Index (PPI) surged 0.3%. Meanwhile, building permits slipped by 1.5% to a rate of 1.470 million units in the same period.
- 🏭 The S&P Global Manufacturing PMI showed improvement, rising from 50.7 to 51.5, while the S&P Global Services PMI edged lower from 52.5 to 51.3.
- 📉 The number of individuals seeking unemployment benefits in the US decreased by 12,000 to 201,000 last week.
Macroeconomic Analysis
Producer Price Index (PPI)
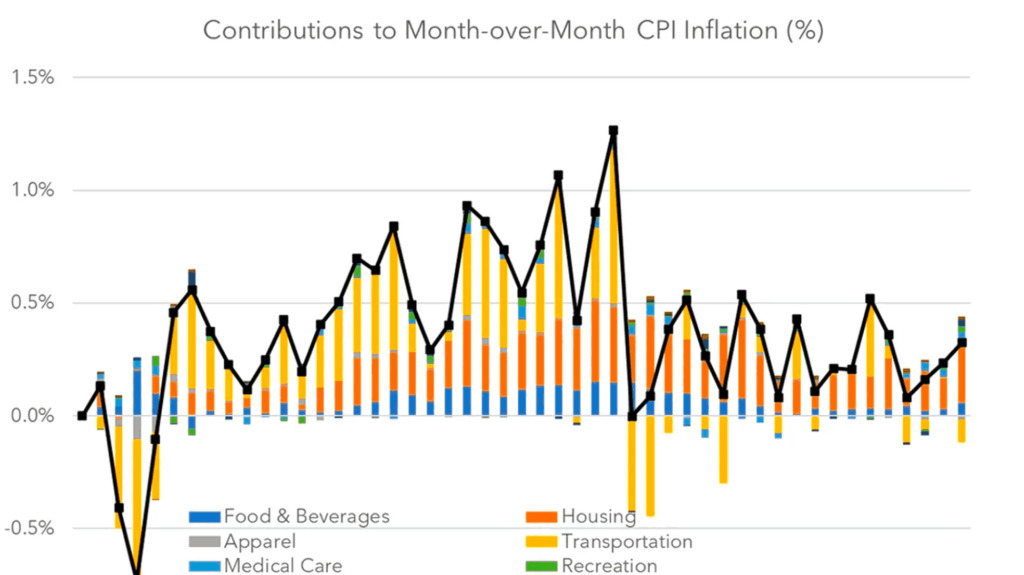
The January 2024 surge of 0.3% in the Producer Price Index (PPI) is indicative of mounting inflationary pressures. This rise was mirrored by a 0.5% increase in the Core PPI (excluding food and energy), mirroring the 0.3% and 0.4% increases in headline and core Consumer Price Index (CPI), respectively. These figures hint at the potential cost-of-living adjustments impacting the broader economy.
Other indicators offered a more nuanced outlook. The US Index of Leading Indicators fell 0.4% to 102.7, slightly exceeding expectations but hinting at future economic challenges. Despite this, the decline in the dollar’s value, coupled with slight February improvements in consumer sentiment and near-term inflation expectations, presents a different perspective. Analysts, including one from Citi, anticipate a challenging future with no soft landing expected and potential signs of recession in the summer, highlighting the complexities of the current economic landscape.
Other Economic Indicators
- Housing Permit: The National Association of Home Builders reports a 4.7% decrease in single-family home construction in January 2024. Despite this decline, optimism for a recovery is supported by a 1.6% increase in single-family home construction permits to 1.015 million units and a rise in builder confidence to the highest level in 18 months. However, construction starts for projects with five or more units dropped sharply by 35.8% to 314,000 units, contributing to an overall 14.8% decrease in housing starts to 1.331 million units, well below the forecasted 1.460 million units. Additionally, multi-family building permits and total building permits both decreased, falling by 9.0% to 405,000 units and 1.5% to 1.470 million units, respectively, suggesting mixed signals for the future direction of the housing market.
- Michigan Consumer Sentiment: The index remained relatively stable in February at 79.6, only slightly up from January but below expectations (80.0). This stability reflects ongoing consumer confidence in the economy, with optimism about future business conditions reaching its highest level since December 2020. Although sentiment is still 6% or below its historical average, it is 30% higher than in November 2023, reflecting improvements in inflation and the labor market.
- Initial Jobless Claim: U.S. new unemployment claims dropped to a 5-week low of 201,000 for the week ending February 17, falling below the expected 218,000 and marking the lowest number since the 189,000 recorded five weeks prior. Continuing claims also decreased to 1.86 million. This data indicates an easier job market for the unemployed and points to a currently tight U.S. labor market, allowing the Fed to maintain steady interest rates despite inflation concerns.
- S&P Global PMI: Despite slow growth, the U.S. private sector continued to expand in February**.** The manufacturing sector experienced a positive increase (PMI at 51.5), reaching its highest level in 10 months. While the services sector weakened slightly (PMI decreased to 51.3), it remained in expansion territory. Notably, both sectors saw reduced cost pressures, with input price growth being the slowest since October 2020. This PMI data indicates an annualized U.S. economic growth of about 2% in the first quarter. The Fed is likely to tighten its monetary policy but may consider lowering interest rates by June.
BTC & ETH Price Analysis
BTC
The Bitcoin market is facing challenges around the $51,000-52,000 level, which appears to be a region causing considerable noise for longer-term traders. Currently, the market is dealing with an overextension, and efforts are being made to navigate through this level. While the occurrence of a short-term pullback is uncertain in the immediate future, it seems likely within the next week. Despite this, there are compelling reasons to consider going long once again. In the event of a breakthrough above the recent highs from the last couple of weeks, the potential targets lie at $55,000, followed by $60,000.
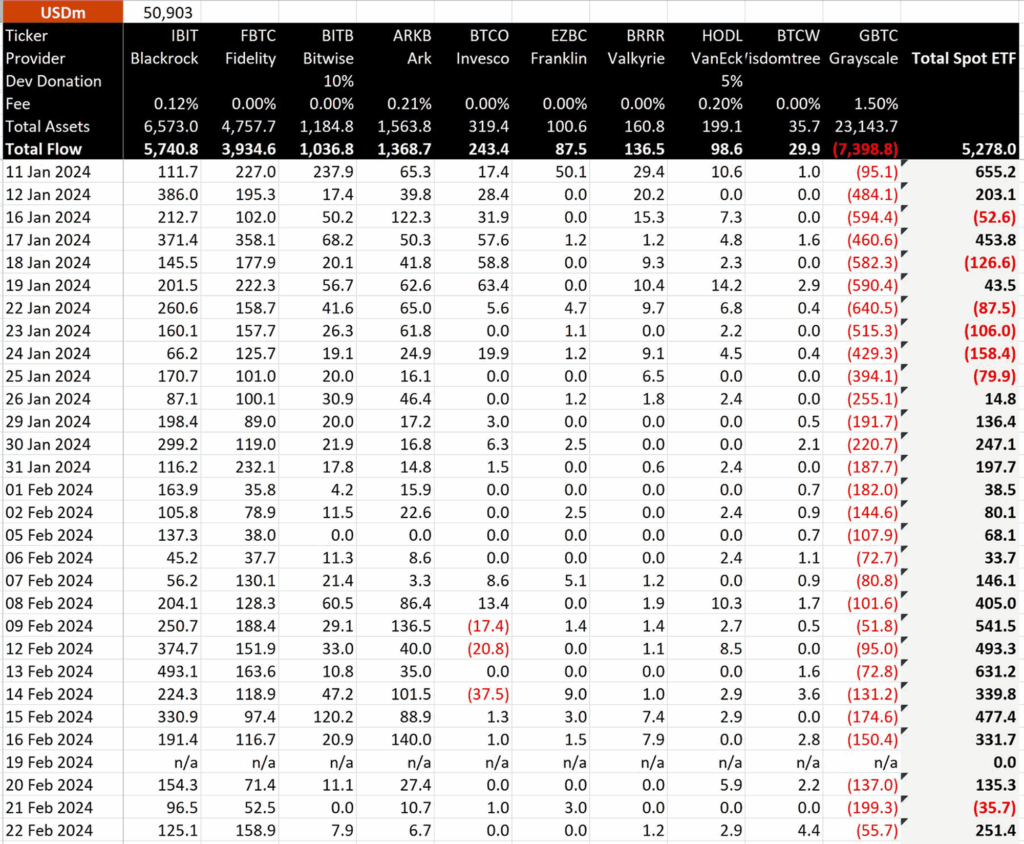
Bullish momentum has been confined within a tight trading range for over a week. Concerns have arisen regarding the influx of funds into spot Bitcoin exchange-traded funds (ETFs), which have notably slowed down in recent days. On February 21, there was even a net outflow of approximately $36 million.
ETH
Investors are closely monitoring the possible approval of spot Ethereum ETFs, but the current focus is on the upcoming Ethereum Dencun upgrade set for March 13. This imminent improvement is expected to have a substantial impact, potentially providing support to various participants in the Ethereum ecosystem.
Examining the potential ramifications, let’s explore how the Ethereum Dencun upgrade could positively affect other Layer-2 platforms within the Ethereum ecosystem.
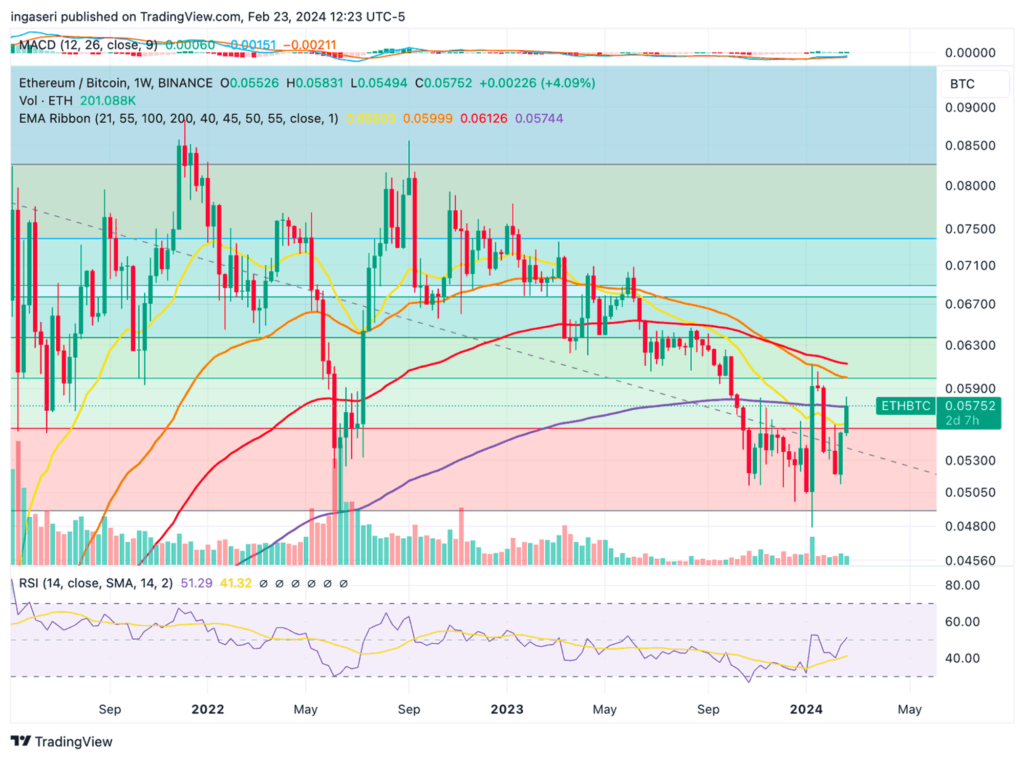
Looking at the chart below, we can see that ETH/BTC have encountered a resistance at the 200 week EMA line. Passing through this resistance line would continue the upward momentum that ETH has over BTC.
Total Crypto Market
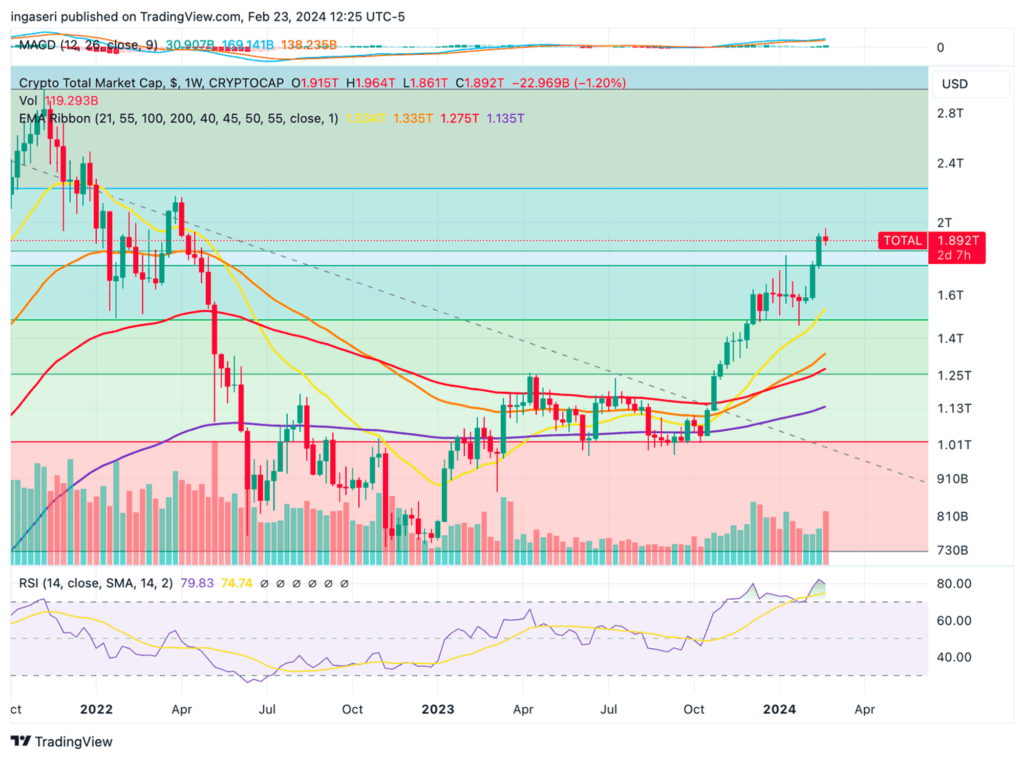
The entire cryptocurrency market currently sits at $1.89 trillion, despite experiencing a -1.2% decline.
On-Chain Analysis
- 📊 Exchange: As the exchange reserve continues to fall, it indicates lower selling pressure. Net deposits on exchanges are high compared to the 7-day average. Higher deposits can be interpreted as higher selling pressure.
- 💻 Miners: Miners’ are selling holdings in a moderate range compared to its one-year average. Miner’s revenue is in a moderate range, compared to its one-year average.
- 🔗 On-Chain: More investors are selling at a profit. In the middle of a bull market, it can indicate a market top. Long-term holders’ movements in the last week were higher than the average. If they were moved for selling, it may have a negative impact. Investors are in a belief phase where they are currently in a state of high unrealized profits.
- 🏦 Derivatives: Long-position traders are dominant and are willing to pay short traders. Selling sentiment is dominant in the derivatives market. More sell orders are filled by takers. As open interest decreases, it indicates investors are closing futures positions and the possibility of trend reversals. In turn, this might trigger the possibility of long/short-squeeze caused by sudden price movement or vice versa.
- 🔀 Technicals: RSI indicates an overbought condition where 81.00% of price movement in the last 2 weeks has been up and a trend reversal can occur. Stochastic indicates an overbought condition where the current price is close to its high in the last 2 weeks and a trend reversal can occur.
News About Altcoins
- SingularityNET (AGIX) Records Sharp Rise Up to 90%. AGIX, an AI-focused token, reached a new all-time high after a previous 128% surge in the week leading up to February 22. This surge was fueled by a record-breaking transaction volume of $119.6 million on February 22 and significant whale activity. Notably, the number of SingularityNET holders reached a new peak of 93,632 and boasted a social dominance of 0.18%. Technical price analysis of AGIX shows an upward trend since January 26, with the price rising from $0.24 to nearly $0.80, surpassing the previous record on February 3 at $0.67.
News from the Crypto World in the Past Week
- Ethereum ETH Expected to Be Approved in 2025. Valkyrie Chief Investment Officer Steven McClurg suggests that a Spot Ethereum ETF might not be approved shortly, but approval could be possible within the next year or two. This comes after the SEC approved the first spot Bitcoin ETFs in the US, attracting billions of dollars to the crypto market. Major firms like Fidelity and BlackRock have filed for a spot in Ethereum ETF, and some analysts predict the earliest approval could come by May 2023. However, there are several hurdles, such as the differences between bitcoin and ether, as well as the staking component in Ethereum that could increase concentration risk, making the approval process more complex. McClurg discussed the potential for an XRP ETF given the recent legal developments with Ripple facing the SEC, highlighting the evolving dynamics in crypto asset regulation and the prospects for ETFs.
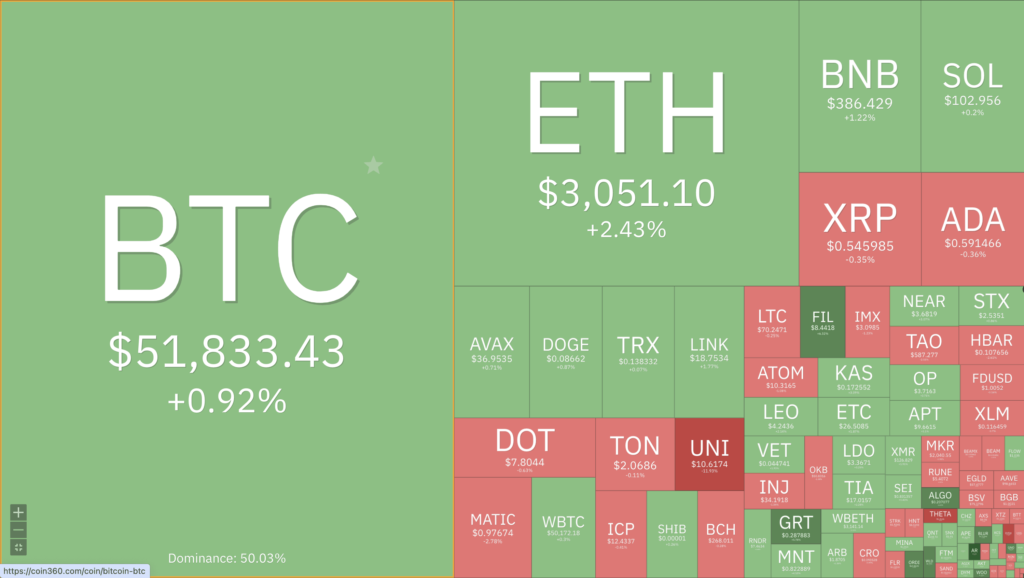
Cryptocurrencies Market Price Over the Past Week
Cryptocurrencies With the Best Performance
- SingularityNET (AGIX) +64,14%
- Worldcoin (WLD) +60,35%
- Uniswap +38,60%
- Filecoin +37,83%
Cryptocurrencies With the Worst Performance
- Starknet (STRK) -18,40%
- Dymension (DYM) -16,06%
- Sei (SEI) -13,20%
- Injective -12,11%
References
- Nikola Lazic, SingularityNET Price Reaches All-Time High as AI Token AGIX Shows High On-chain Activity, ccn, accessed on 25 February 2024.
- Sarah Wynn, Valkyrie CIO anticipates spot Ethereum ETF approval will take 1-2 years, theblock, accessed on 25 February 2024.
Share
Related Article


See Assets in This Article
BTC Price (24 Hours)
Market Capitalization
-
Global Volume (24 Hours)
-
Circulating Supply
-