Market Analysis Mar 25th, 2024: BTC Must Maintain $65K Support for Continued Bull Run

Bitcoin has not yet reached its previous peak levels following a significant correction, at one point dipping to $60,800, a decrease of about 17%. This drop has triggered various responses and sparked many speculations regarding the future of BTC prices and the broader crypto market. Read the analysis below for more insights.
As usual, the Pintu trading team has gathered critical information and analyzed the general economic situation and the crypto market’s movements over the past week. However, it should be noted that all information in this Market Analysis is intended for educational purposes, not as financial advice.
Market Analysis Summary
- ⚠️ If BTC successfully reclaims the $67,000-$69,000 level, there is a high probability that the bullish trend will continue.
- 📉 The General Business Conditions diffusion index plummeted to -20.9 from February’s -2.4.
- 🟢 The Fed decided to maintain interest rates at their current level.
- 📈 Building permits rose to 1,518,000 in February, marking a 1.9% increase from January.
Macroeconomic Analysis
Fed Interest Rate Decision
At the conclusion of this week’s policy-setting meeting, the Fed decided to maintain interest rates at their current level, a move widely anticipated by market observers. Despite recent mixed economic data, including increased inflation readings over the past two months, officials remain committed to their earlier forecast of reducing interest rates by three-quarters of a percentage point by the year’s end. However, they now anticipate higher rates in the years ahead.
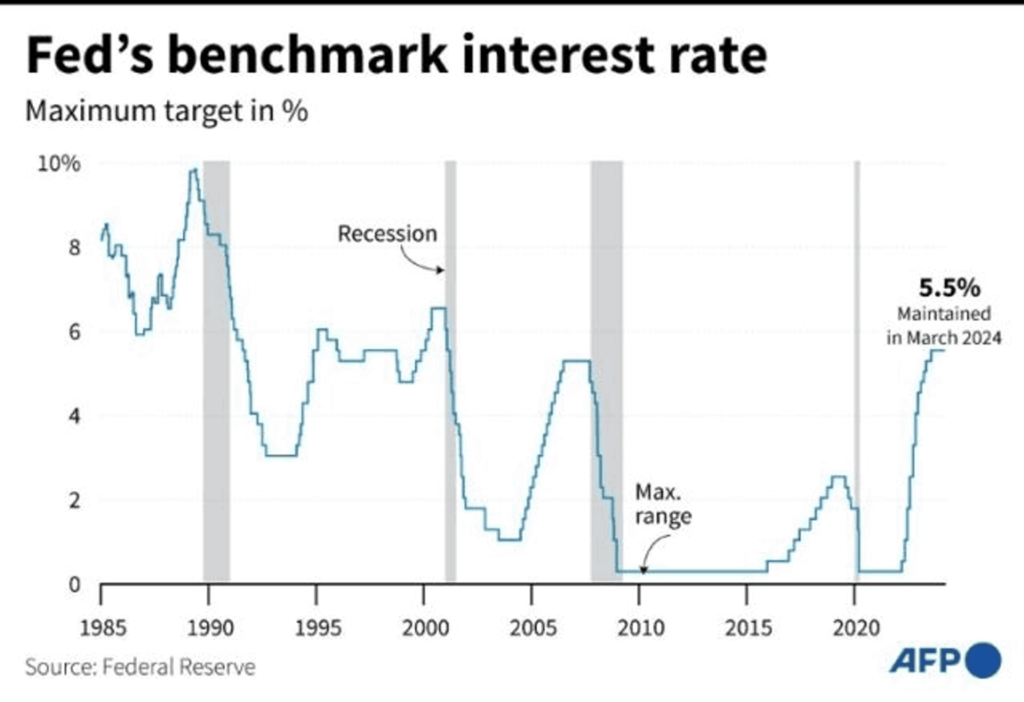
Fed officials are adopting a prudent yet assured stance. The outcomes of the recent Federal Open Market Committee meeting didn’t significantly alter expectations regarding rate cuts. However, officials express confidence that as the year progresses, the United States will reach a stage where inflation steadily approaches the 2% target, warranting a reduction in interest rates.
Other Economic Indicators
- NY Empire State Manufacturing Index: The March 2024 Empire State Manufacturing Survey underscored the continued decline in New York State manufacturing activity, with the General Business Conditions index dropping significantly to -20.9 from -2.4 in February (a steeper decline than the anticipated -7.0). This downturn is characterized by a decrease in demand: significant reductions in new orders and shipments, alongside declines in unfilled orders and inventories. The labor market in this sector also weakened, with reductions in employment and work hours. Although the rate of input price increases slightly slowed, selling prices continued to rise at a steady rate. Despite the downturn, companies remain cautiously optimistic about potential improvements in the next six months.
- Michigan Consumer Index: The Michigan Consumer Sentiment Index for March showed a slight decrease of 0.4 points to 76.5, amid ongoing concerns over inflation rates that continue to exceed the Federal Reserve’s 2% target. Despite a minor dip in sentiment following a report of a 3.2% year-over-year increase in the consumer price index for February, consumer inflation expectations for the coming year remain stable at 3%, and their long-term outlook for the next five to ten years also remains stable at 2.9%. These expectations are slightly higher than pre-pandemic averages, indicating a nuanced view among consumers who anticipate a gradual decline in inflation.
- Building Permits: In February, there was a significant increase in building permits, reaching a seasonally adjusted annual rate of 1.518 million units. This figure represents a 1.9% increase from the revised January figure of 1.489 million and a 2.4% increase from February 2023. Notably, single-family authorization rose to 1.031 million, marking a 1.0% increase from January. Additionally, authorizations for buildings with five units or more showed strength at 429,000.
- Housing Starts: New housing construction in February surged to a seasonally adjusted annual rate of 1.521 million units, reflecting a significant increase of 10.7% from January and 5.9% year-over-year. Single-family housing performed particularly well, rising 11.6% to 1.129 million units. Starts for buildings with five or more units reached 377,000. This impressive performance in building permits, housing starts, and completions indicates an optimistic outlook for the residential construction sector in the near term.
- Home Sales: The National Association of Realtors reported a significant 9.5% surge in home sales in February, reaching 4.38 million units, the highest level since February 2023. This increase stemmed from an improvement in housing supply, which grew by 5.9% to 1.07 million units (the highest for any February since 2020) and a 10.3% year-over-year increase. Although there was a 3.3% year-on-year decline in home resales, the increase in inventory and declining mortgage rates signal strong potential for the upcoming spring selling season, suggesting an easing in the housing market.
- Jobless Claims: Two weeks ago, the U.S. economy exhibited resilience with an unexpected decrease in new unemployment claims and a significant increase in existing home sales, indicating continued strength in the first quarter. The Labor Department’s report showed a slight drop in unemployment claims to 210,000, below economists’ prediction of 215,000, during stable business activity and rising inflation in March. Additionally, a leading indicator of future economic activity turned positive for the first time in two years, further affirming the strong performance of the U.S. economy compared to other countries worldwide.
BTC Price Analysis
Bitcoin’s drop below $61,000 led to a correction across the market. Despite the influx of new capital, the primary cryptocurrency experienced a 15% decline at one stage during the week after reaching record highs earlier in the month.
BTC bull market remains ongoing, with a continued rotation of liquidity expected to drive the asset to further highs post-halving. However, there is potential “violent” near-term correction due to lingering leverage in the market.
One of the primary drivers behind the BTC rally this year, along with the subsequent boost in investor confidence, has been the influx of funds into spot Bitcoin ETFs. This peaked on March 12 at an impressive $1.045 million. However, recent data indicates a decline in net inflows, paralleling a decrease in spot prices.
There is a significant net outflow of $326.2 million , marking the largest single-day outflow recorded. This triggered an immediate reaction from BTC, causing it to plummet to lows of 60,770 before rebounding above 63,000. Despite continued outflows, the asset surged to over $68,000.
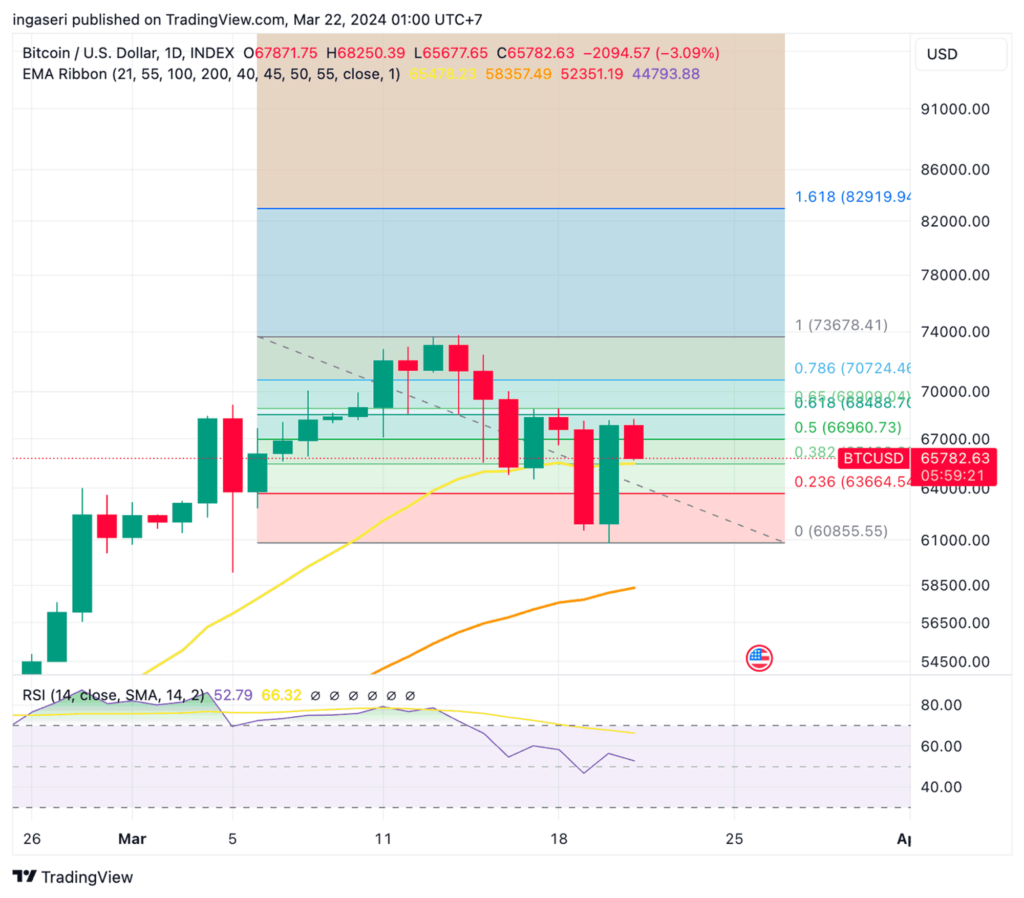
BTC Technicals
On the daily chart, there has been a sustained rally in price since bouncing back from the $40K threshold. Nevertheless, the market has recently pulled back from the resistance level at $75K.
Currently, the market is testing the $67K – $69K range (notice the Fibonacci golden pocket resistance), and if it manages to reclaim this level, a bullish trend continuation becomes likely.
Support is at $65K level. If here is a rejection, it could prompt a decline towards $58K and potentially even lower levels.
On-Chain Analysis
- 📊 Exchange: As the exchange reserve continues to fall, it indicates lower selling pressure. Net deposits on exchanges are high compared to the 7-day average. Higher deposits can be interpreted as higher selling pressure.
- 💻 Miners: Miners’ are selling more holdings compared to its one-year average. Miner’s revenue is in a moderate range, compared to its one-year average.
- 🔗 On-Chain: More investors are selling at a profit. In the middle of a bull market, it can indicate a market top. Long term holders’ movement in the last 7days was higher than the average. If they were moved for the purpose of selling, it may have negative impact. Investors are in a belief phase where they are currently in a state of high unrealized profits.
- 🏦 Derivatives: Long-position traders are dominant and are willing to pay to short traders. Buying sentiment is dominant in the derivatives market. More buy orders are filled by takers. As open interest decreases, it indicates investors are closing futures positions and possibility of trend reversals. In turn, this might trigger the possibility of long or short-squeeze caused by sudden price movement or vice versa.
- 🔀 Technicals: RSI indicates a neutral ****condition. Stochastic indicates a neutral condition where the current price is in a moderate location between the highest-lowest range of the last 2 weeks.
News About Altcoins
- Memecoin Enthusiasts, Heed the Call from Solana’s Co-Founder. Solana Labs Co-Founder Anatoly Yakovenko has warned the community against investing in Solana-based memecoin pre-sales. This warning follows data shared by ZachXBT, highlighting significant investments in various memecoin projects, with one amassing nearly $30.5 million. The memecoin craze has previously contributed to a surge in SOL prices, exceeding $200 and setting a new all-time high market cap. However, Yakovenko’s cautionary stance underscores concerns about the negative impact of memecoins on the network, despite their role in stress testing Solana’s ability to handle network congestion.
News from the Crypto World in the Past Week
- BlackRock Unveils a Plan to Tokenize $10 Trillion in Assets. BlackRock, the world’s largest asset manager, has unveiled a major initiative to tokenize $10 trillion of its assets in collaboration with Securitize. This ambitious plan aims to leverage blockchain technology to enhance liquidity, transparency, and accessibility of real-world assets (RWAs), ranging from equity and bonds to real estate. BlackRock launched its first tokenized fund, the BlackRock USD Institutional Digital Liquidity Fund, on the Ethereum blockchain. This initiative not only underscores BlackRock’s innovation-driven approach in the financial sector but also signals a transformative era for investment strategies, potentially democratizing access to investment opportunities.
Cryptocurrencies Market Price Over the Past Week
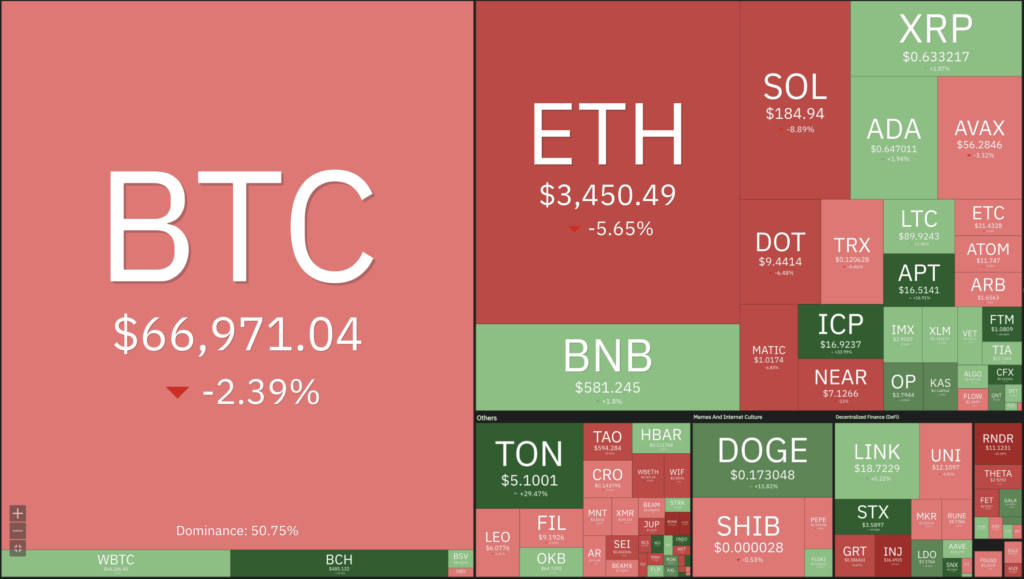
Cryptocurrencies With the Best Performance
- Ondo (ONDO) +36%
- Stacks +27%
- Fantom +12%
- Maker (MKR) +8%
Cryptocurrencies With the Worst Performance
- Sei -26%
- Bonk (BONK) -24%
- Injective -21%
- Helium (HNT) -19%
References
- Natalia Karayaneva, BlackRock’s $10 Trillion Tokenization Vision: The Future Of Real World Assets, Forbes, accesed on 23 March 2024.
- Liam Akiba Wright, Solana co-founder Anatoly tells community to stop investing in memecoin pre-sales, Cryptoslate, accesed on 23 March 2024.
Share
Related Article


See Assets in This Article
BTC Price (24 Hours)
Market Capitalization
-
Global Volume (24 Hours)
-
Circulating Supply
-