3 Crypto with Rebound Potential in March 2024 According to Elliott Wave Analysis
Jakarta, Pintu News – The crypto market continues to fluctuate, but some assets are showing signs of strong trend reversals. Elliott Wave Theory is one of the technical analysis methods used to predict price movements based on repeating wave patterns.
According to this theory, markets move in five impulse waves that reflect the main trend and three correction waves before entering a new cycle. Using this approach, some analysts see rebound opportunities in a number of crypto assets that have completed the correction phase.
Here are three cryptos that have the potential to rebound in March 2024 based on Elliott Wave analysis.
Solana (SOL)
Solana (SOL) continues to attract attention for its high-performance blockchain capabilities, offering fast transaction speeds and low fees.
Recent developments have further boosted investor confidence, especially with the possible approval of Solana-based ETFs under the current US administration. If this regulation is approved, institutional adoption of Solana could increase, pushing up the value of SOL.
Read also: 3 Hidden Gem Altcoins to Watch in March 2025
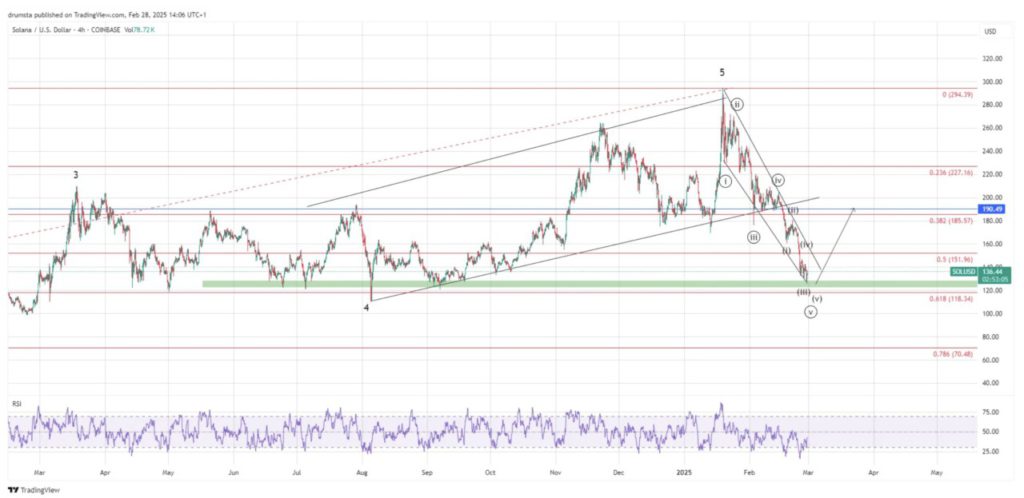
Reporting from CCN (2/3/25), the price of Solana (SOL) had a sharp decline from its peak around $294, breaking the rising channel pattern. The price movement is currently testing strong support around $136, which aligns with the 0.5 Fibonacci retracement level.
The Relative Strength Index (RSI) indicator shows that SOL is in an oversold condition, which increases the chances of a price bounce. If the price manages to break $185 (0.382 Fibonacci level), this could signal a trend reversal, with the next target at $227.
However, if Solana fails to maintain support, a deeper correction could occur up to $118 (0.618 Fibonacci level). Elliott Wave analysis also shows that the five-wave decline has reached an end point, opening up the opportunity for a potential upward retracement.
Polka dot (DOT)
Polkadot (DOT) continues to strengthen its position as one of the leading platforms for inter-blockchain interoperability.
With the continuous improvement of the parachain ecosystem and increasing institutional interest, Polkadot enables seamless interaction between various blockchains, making it a favorite among developers building scalable decentralized applications (dApps).
According to a CCN report (2/3/25), Polkadot (DOT) is still in a prolonged downward trend, with the price pattern forming a descending channel. The latest low of $4.63 aligns with the 0.786 Fibonacci retracement level, which is a potential bottom.
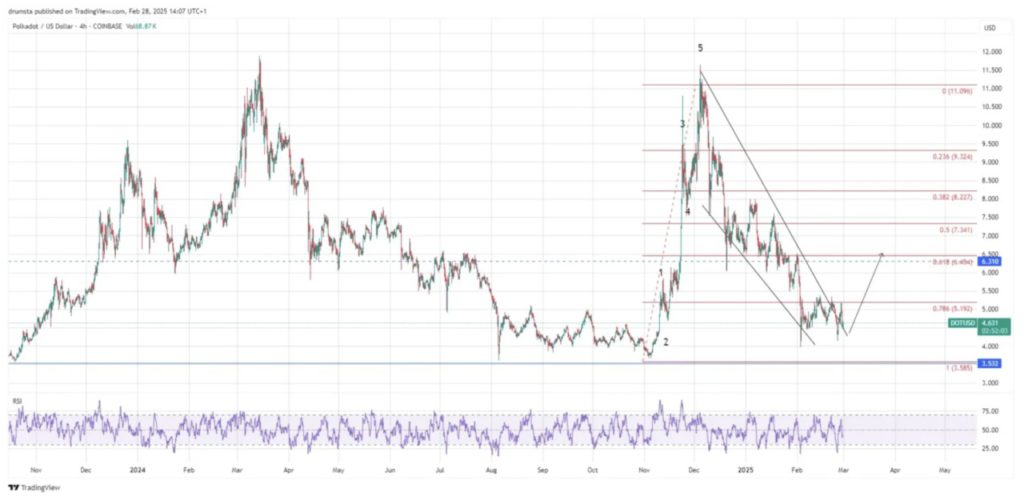
The Relative Strength Index (RSI) indicator is recovering from oversold conditions, indicating a possible rebound. If the price manages to break $6.31 (0.618 Fibonacci level), this could be a confirmation of a trend reversal, with the next targets at $7.34 and $8.22.
However, if the DOT fails to maintain support, the price could drop further to $3.58. Based on Elliott Wave analysis, the price correction has been completed, which means a potential bullish move could be imminent if buying pressure increases.
Read also: Dogecoin Price Prediction: Will DOGE Skyrocket to $1? Crypto Whales Are Making Moves!
XRP
XRP (XRP), which is used in Ripple Labs’ digital payment platform, showed strong interaction with the support level in the past 24 hours, gaining 5% (2/3/25), with further upside potential.
This growth is expected to be driven by price movement factors as well as reduced regulation on digital assets under the current US administration.
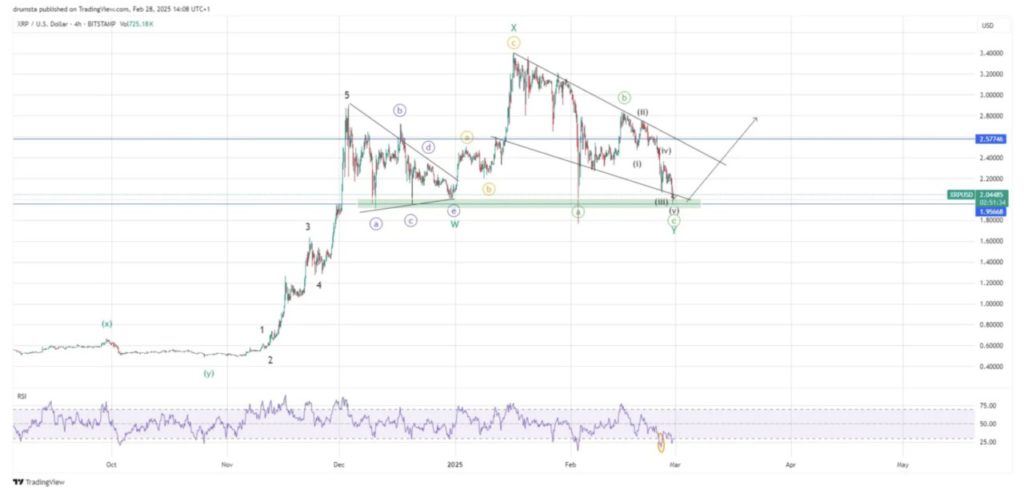
Technically, the XRP chart shows a correction pattern after the strong rally in December, forming a falling wedge structure. Currently, the price has reached an important support zone around $1.95-$2.00, which coincides with the previous consolidation area.
The Relative Strength Index (RSI) indicator is in the oversold zone, indicating a possible trend reversal. If XRP manages to break out of the falling wedge pattern, the price could head towards the resistance at $2.58, which aligns with the previous high.
However, if the support fails to hold, the next level to watch is around $1.80. Based on Elliott Wave analysis, the correction wave (C) seems to have completed, opening up opportunities for an uptrend if buying pressure increases.
Read also: Is Pi Network Set to List on Binance This Week? Here’s What You Need to Know!
Conclusion
Overall, the three altcoins-XRP, Solana (SOL), and Polkadot (DOT)-show similar technical patterns. Each has retraced to a major horizontal support zone, marking the end of their downward structure.
The price correction appears to be complete, with price action forming a potential trend reversal setup. The RSI indicators on all charts are showing oversold conditions, increasing the chances of a rebound.
If the price manages to break this structure in March, it could trigger a larger recovery, in line with the projected targets. If bullish momentum returns, these three altcoins have significant upside opportunities, making them assets worth watching in the weeks ahead.
That’s the latest information about crypto news today. Get more information about crypto academy from beginner to expert level only at Pintu Academy and enrich your knowledge about the world of crypto and blockchain.
Follow us on Google News to get the latest information about crypto and blockchain technology. Enjoy an easy and secure crypto trading experience by downloading Pintu Crypto via Google Play Store or App Store now.
Experience web trading with advanced trading tools such as pro charting, various order types, and portfolio tracker only at Pintu Pro. Click Register Pintu if you don’t have an account or click Login Pintu if you are already registered.
*Disclaimer
This content aims to enrich readers’ information. Pintu collects this information from various relevant sources and is not influenced by outside parties. Note that an asset’s past performance does not determine its projected future performance. Crypto trading activities have high risk and volatility, always do your own research and use cold cash before investing. All activities of buying and selling bitcoin and other crypto asset investments are the responsibility of the reader.
Reference:
- CCN. 3 Altcoins That Could See a Big Breakout in March 2025 Amid Market Shifts. Accessed on March 4, 2025
Latest News
© 2026 PT Pintu Kemana Saja. All Rights Reserved.
The trading of crypto assets is carried out by PT Pintu Kemana Saja, a licensed and regulated Digital Financial Asset Trader supervised by the Financial Services Authority (OJK), and a member of PT Central Finansial X (CFX) and PT Kliring Komoditi Indonesia (KKI). Crypto asset trading is a high-risk activity. PT Pintu Kemana Saja do not provide any investment and/or crypto asset product recommendations. Users are responsible for thoroughly understanding all aspects related to crypto asset trading (including associated risks) and the use of the application. All decisions related to crypto asset and/or crypto asset futures contract trading are made independently by the user.