Dogecoin Surges 2% Today—Is This the Start of a Major Rally?
Jakarta, Pintu News – Dogecoin (DOGE) has completed a W-X-Y-X-Z-shaped long corrective structure on the higher time frames, and now seems to be entering the initial phase of a new upward impulsive wave.
The price consolidated after a sharp rally, with a retracement to important support levels based on Fibonacci and price structure.
The Elliott Wave count indicates that wave (iv) has completed, and wave (v) is likely to begin soon. If this is confirmed, a bullish setup opportunity will arise.
Then, how is the current Dogecoin price movement?
Dogecoin Price Rises 2.00% within 24 Hours
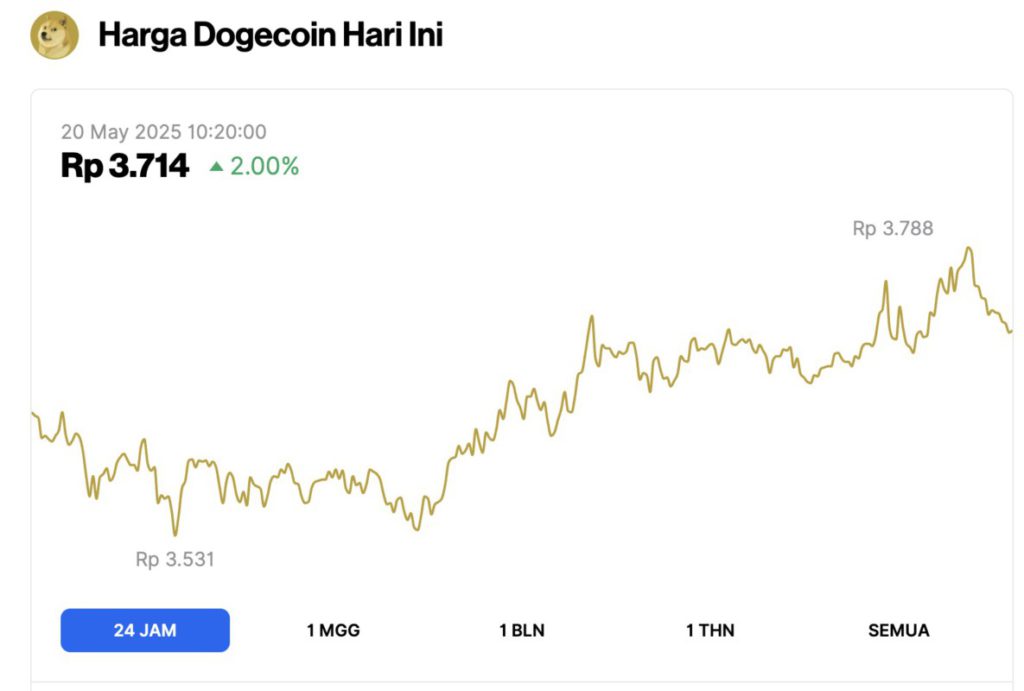
On May 20, 2025, Dogecoin saw a 2.00% rise over the past 24 hours, with its price climbing to $0.2267, or approximately IDR 3,714. During the day, DOGE traded as low as IDR 3,351 and reached a peak of IDR 3,788.
At the time of writing, Dogecoin’s market cap stands at around $33.89 billion, with trading volume dropping 23% to $2.01 billion within 24 hours.
Read also: Ethereum Just Surged 7% — Is This the Start of a Massive Breakout?
DOGE Price Analysis
According to CCN (5/19/25), DOGE’s 4-hour chart shows that the W-X-Y-X-Z-shaped long-term corrective decline has been completed, with a low of $0.131 on April 7.
This low point became the start of a sharp upward movement, breaking the descending wedge pattern and invalidating the previous bearish market structure.
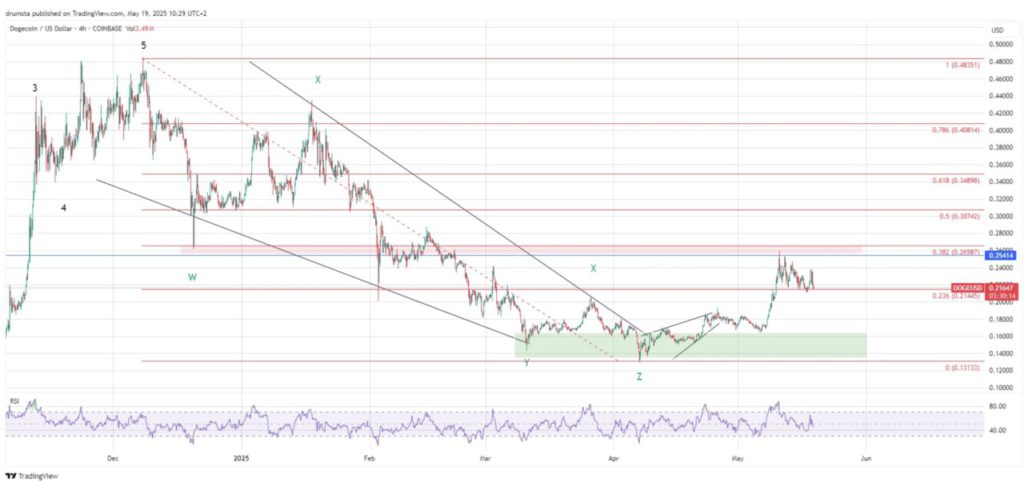
After that, there was a significant impulsive spike, with DOGE prices reaching almost $0.26 – close to the 0.382 Fibonacci level – before starting to consolidate.
The retracement is currently around the 0.236 Fibonacci level at $0.214, and this zone is being tested as support.
The RSI (Relative Strength Index) indicator is in neutral territory, around the 50 mark, indicating that the price movement is declining from overbought conditions without showing strong bearish momentum.
DOGE is also testing a horizontal zone that was previously resistance and now serves as support, in the $0.215-$0.220 range. This zone reinforces support along with Fibonacci levels.
If this zone is successfully defended, it could confirm the start of wave (v) towards new local highs. But if this support fails to hold, DOGE risks a deeper retracement, potentially back to $0.18 or lower.
Overall, the price structure and momentum indicators point to a healthy correction within the broader uptrend. However, a higher low formation and breakout from consolidation is required to confirm the continuation of the bullish trend.
Read also: If Bitcoin Explodes to $250K, This Is How High Dogecoin Could Soar!
DOGE Price Prediction
On the 1-hour chart, DOGE is forming a descending triangle pattern that appears to be completing the last wave (e) of the corrective structure (a)-(b)-(c)-(d)-(e). This pattern generally precedes breakouts and trend continuation.
The current support zone around $0.215 in line with the horizontal structure and the 0.236 Fibonacci level, provides a strong basis for a potential bullish reversal.
Wave (iv) seems to be almost complete, having experienced a retracement from the $0.265 high to the $0.215 area.
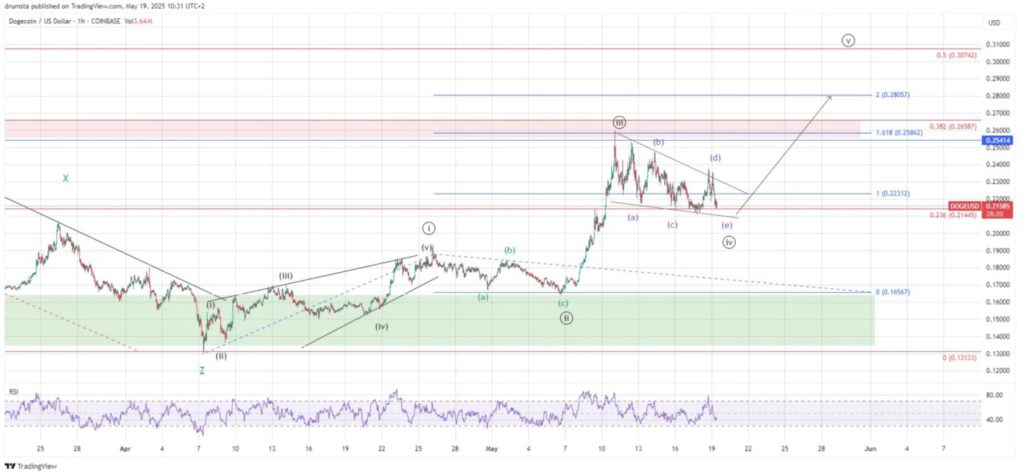
Once wave (e) ends, a new bullish wave (V) is expected to form and target key Fibonacci extension levels.
Based on the wave height (iii), the 1.618 extension target points to $0.258, while the 2.0 extension target is at $0.280 – which means a potential upside of about 31% from the current price level.
The RSI on the 1-hour time frame has almost reached oversold territory, supporting the possibility of an upward price bounce in the near term.
If DOGE manages to bounce and break $0.223 upwards again, this would be a strong signal of continued bullish momentum and possibly push the price towards the $0.25-$0.28 range.
However, this bullish scenario will be invalidated if DOGE breaks below $0.214 with significant volume, which could pave the way for a drop to the $0.20-$0.18 area.
As long as this support holds, bullish market participants seem to be preparing for the next step up.
That’s the latest information about crypto. Follow us on Google News to stay up-to-date on the world of crypto and blockchain technology.
Enjoy an easy and secure crypto trading experience by downloading Pintu crypto app via Google Play Store or App Store now. Also, experience web trading with advanced trading tools such as pro charting, various types of order types, and portfolio tracker only at Pintu Pro. Pintu Pro Futures is also available, where you can buy bitcoin leverage, trade btc futures, eth futures and sol futures easily from your desktop!
*Disclaimer
This content aims to enrich readers’ information. Pintu collects this information from various relevant sources and is not influenced by outside parties. Note that an asset’s past performance does not determine its projected future performance. Crypto trading activities have high risk and volatility, always do your own research and use cold cash before investing. All activities of buying and selling bitcoin and other crypto asset investments are the responsibility of the reader.
Reference:
- CCN. Dogecoin (DOGE) Price Eyes 31% Move as Descending Triangle Patterns Signals Imminent Break. Accessed on May 20, 2025
Latest News
© 2026 PT Pintu Kemana Saja. All Rights Reserved.
The trading of crypto assets is carried out by PT Pintu Kemana Saja, a licensed and regulated Digital Financial Asset Trader supervised by the Financial Services Authority (OJK), and a member of PT Central Finansial X (CFX) and PT Kliring Komoditi Indonesia (KKI). Crypto asset trading is a high-risk activity. PT Pintu Kemana Saja do not provide any investment and/or crypto asset product recommendations. Users are responsible for thoroughly understanding all aspects related to crypto asset trading (including associated risks) and the use of the application. All decisions related to crypto asset and/or crypto asset futures contract trading are made independently by the user.