3 Crypto Made in USA in the Spotlight at the End of October 2025, Possible to Rise?
Jakarta, Pintu News – As US markets prepare for a pivotal week – with the latest inflation (CPI) data due soon, a possible rate cut by the Fed in late October, and Jerome Powell’s remarks expected to influence global sentiment – market participants are now watching how crypto reacts to the change in policy direction.
One focus of attention is “Made in USA”-themed crypto assets, which often experience sharp movements when major events occur in the US. Citing BeInCrypto’s report, some assets are starting to show signs of early recovery, while others are at risk of deeper declines – albeit with unexpected patterns.
Solana (SOL)
Among Made in USA-themed coins, Solana (SOL) remains one of the most resilient altcoins, despite the volatile crypto market. Currently, SOL price is down about 23% compared to last month, largely due to the market crash on October 10 dubbed “Black Friday”.
Read also: Solana price flirts with breakout – 20% rise could be a turning point?
However, in the past week, Solana managed to gain more than 2%, signaling a steady recovery effort.
Technically, the price movement structure still shows a bullish trend. Since May, Solana has been moving in an ascending channel pattern, which generally supports a continued upward trend.
If the SOL price manages to break the $204 level (approx. 8.4% upside), the next target is likely to be in the range of $223 to $238. If the price is able to convincingly cross $253, the path to new highs in the short to medium term could open up.
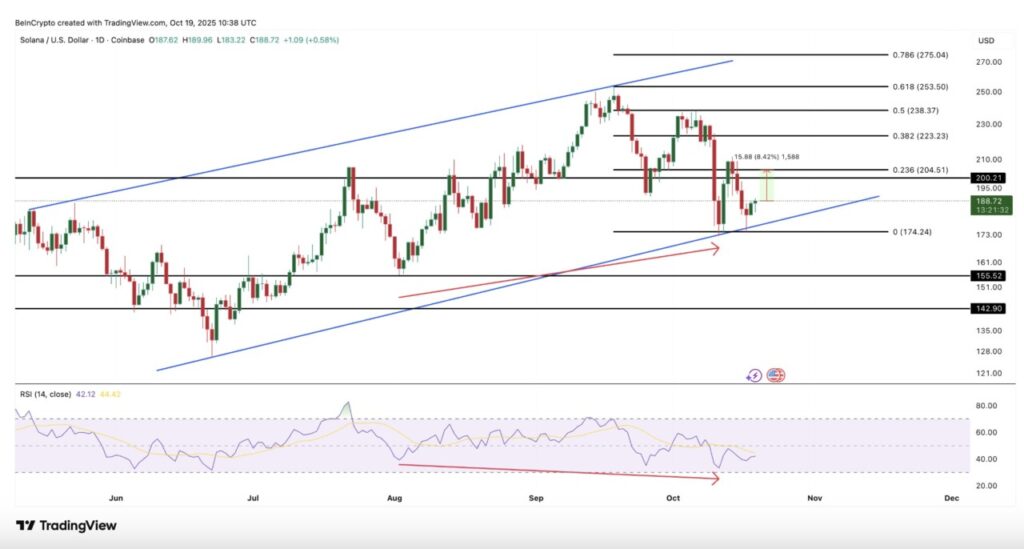
The RSI (Relative Strength Index) indicator, which measures the strength and speed of price movements, reinforces this analysis. Between August 7 and October 11, the Solana price formed higher lows, while the RSI printed lower lows.
Hidden bullish divergence patterns like this usually signal that the overall uptrend is still strong, despite the short-term decline.
However, if SOL’s daily price closes below $174 (the bottom line of the rising channel), then the technical pattern could weaken. In this scenario, Solana’s price could potentially drop to $155 or even $142 – signaling a temporary loss of the bullish structure for one of the major altcoins under the spotlight this October.
Chainlink (LINK)
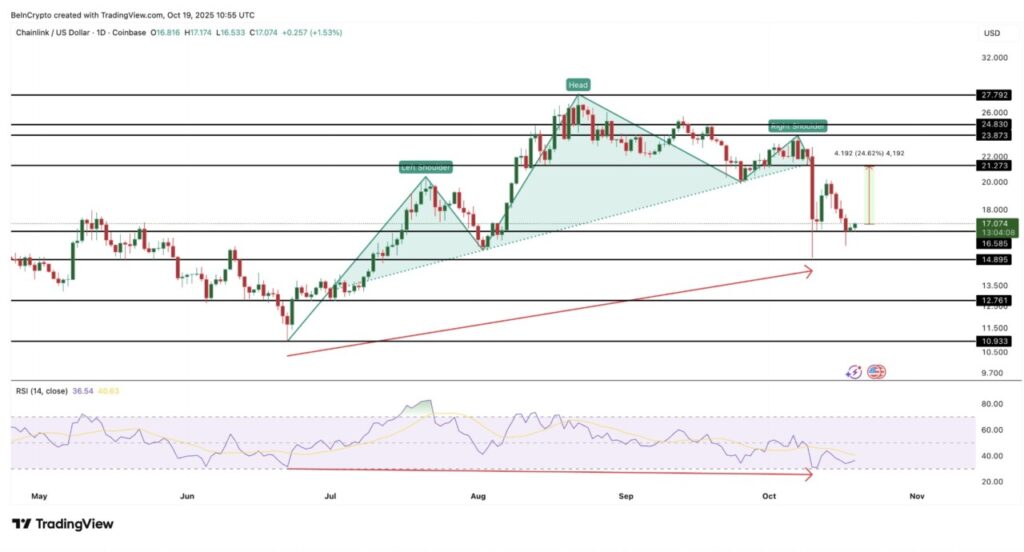
Next on the list of Made in USA coins is Chainlink (LINK), one of the few altcoins to show early signs of recovery despite its sharp decline this month.
In the past 30 days, the price of LINK has plummeted by more than 30%, impacted by the overall crypto market crash in October. However, in the last 24 hours, LINK managed to close in the green – signaling the beginning of buying interest.
One of the factors driving this momentum comes from strong on-chain accumulation. Data from Whaler Talk shows that over 270,000 LINK tokens (worth over $4.6 million) were recently moved from Binance wallets – an indication that whales may be preparing for long-term positions.
Technically, Chainlink broke out of a head-and-shoulders pattern on October 10, with the neckline around the $21 level. This breakout led to a sharp correction towards $14.
But since then, LINK has been on the rise, finding support at $16 – which is now an important zone to base a potential recovery on.
Between June 22 and October 10, LINK’s price formed a higher low, while the RSI indicator printed a lower low. This hidden bullish divergence pattern indicates that the long-term uptrend remains intact, supported by LINK’s 50% rise so far this year, although price pressure is still being felt.
If LINK is able to close the daily candle above $21, this could trigger an upside towards $24 to $27. This means that the short-term upside potential of 24% is still open.
Read also: Crypto Whales Start Accumulating Chainlink: Is LINK Headed for a Sharp Rise?
However, if the price drops below $16 again, the bullish structure will weaken. In that scenario, the price could go back to $14, even $12.
Stellar (XLM)
Among Made in USA coins, Stellar (XLM) stands out for its growing focus onreal-world assets ( RWAs). But currently, XLM is showing more complex movement patterns, making it one of the most volatile altcoins towards the end of October.
Currently, XLM is trading around $0.31 and continues to record inflows fromwhale investors. The Chaikin Money Flow (CMF) indicator – which measures the flow of funds into or out of an asset – has remained above zero since October 7. This suggests that large investors are still adding to positions despite the market pressure.
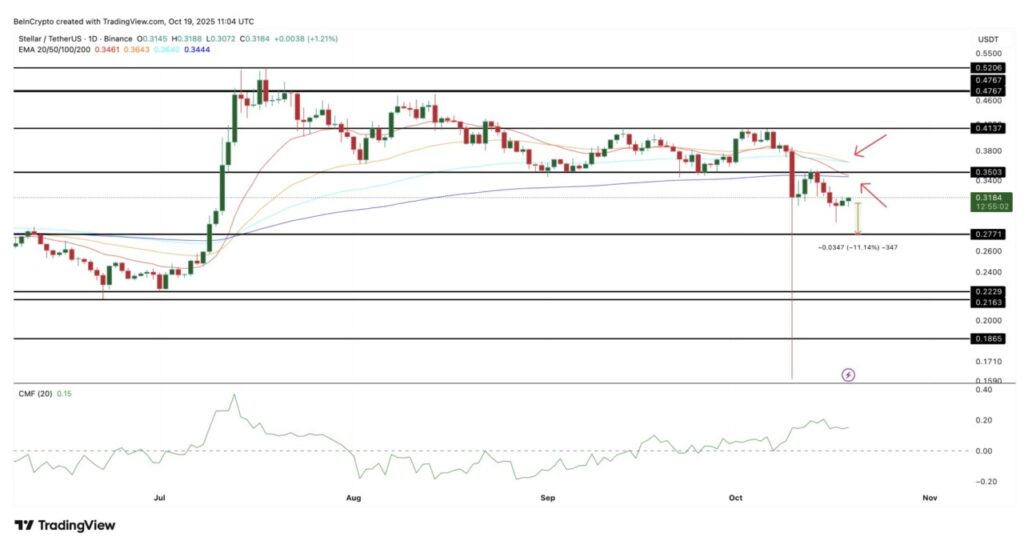
However, this optimism could soon be tested. Technically, on the daily chart, the 20-day Exponential Moving Average (EMA) (red line) is about to break below the 200-day EMA (dark blue line).
Meanwhile, the 50-day EMA (orange line) is also approaching a potential cross below the 100-day EMA (light blue line). Such a cross is known as a “death cross”, which generally indicates that selling pressure is starting to dominate.
If these two death cross patterns do form, bearish momentum could strengthen, pushing XLM prices down to important support at $0.27 (a decline of about 11.4%).
If that level is broken, the next downside target could be $0.22 or even $0.18. However, this negative momentum could soon subside if XLM breaks the $0.35 level first.
Interestingly, the derivatives market situation adds another layer of uncertainty. Data from Bybit shows there are $4.74 million worth of short positions on XLM – a sign that the majority of traders are betting the price will fall.
However, there are still active long positions worth $2.59 million. If the price of XLM drops even slightly, those long positions could be liquidated – which would undermine the optimism of large investors.
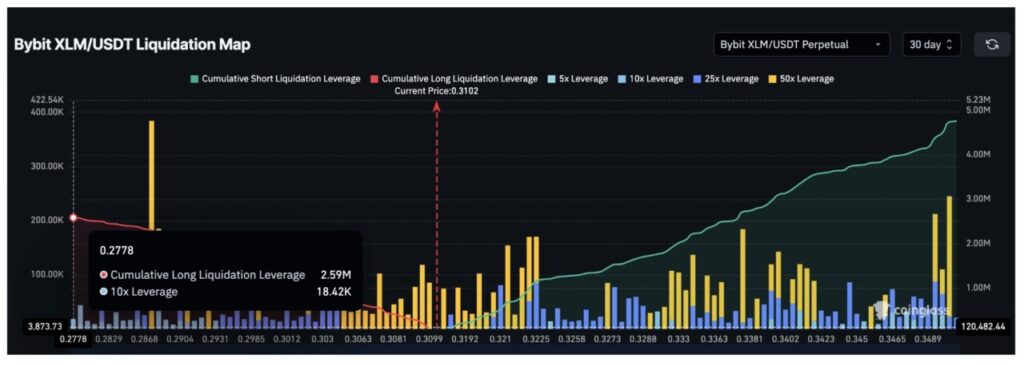
Conversely, if prices rise and trigger the liquidation of short positions, there could be a short squeeze that pushes XLM prices sharply higher – especially if the rate cut actually happens.
For now, Stellar (XLM) is becoming something of a wild card among Made in USA coins – moving between risky market confidence and a potential sharp spike due to short position pressure.
That’s the latest information about crypto. Follow us on Google News to get the latest crypto news about crypto projects and blockchain technology. Also, learn crypto from scratch with complete discussion through Pintu Academy and stay up-to-date with the latest crypto market such as bitcoin price today, xrp coin price today, dogecoin and other crypto asset prices through Pintu Market.
Enjoy an easy and secure crypto trading experience by downloading Pintu crypto app via Google Play Store or App Store now. Also, get a web trading experience with various advanced trading tools such as pro charting, various types of order types, and portfolio tracker only at Pintu Pro.
*Disclaimer
This content aims to enrich readers’ information. Pintu collects this information from various relevant sources and is not influenced by outside parties. Note that an asset’s past performance does not determine its projected future performance. Crypto trading activities have high risk and volatility, always do your own research and use cold cash before investing. All activities of buying and selling bitcoin and other crypto asset investments are the responsibility of the reader.
Reference:
- BeInCrypto. Bullish Made in USA Coins to Watch End of October. Accessed on October 24, 2025
Latest News
© 2026 PT Pintu Kemana Saja. All Rights Reserved.
The trading of crypto assets is carried out by PT Pintu Kemana Saja, a licensed and regulated Digital Financial Asset Trader supervised by the Financial Services Authority (OJK), and a member of PT Central Finansial X (CFX) and PT Kliring Komoditi Indonesia (KKI). Crypto asset trading is a high-risk activity. PT Pintu Kemana Saja do not provide any investment and/or crypto asset product recommendations. Users are responsible for thoroughly understanding all aspects related to crypto asset trading (including associated risks) and the use of the application. All decisions related to crypto asset and/or crypto asset futures contract trading are made independently by the user.


