Pi Network’s Price Slips 3% Today (Oct 28, 2025) After Soaring 24% on Monday
Jakarta, Pintu News – The price of Pi Coin (PI) experienced a surge of nearly 24% in 24 hours on October 27, cutting monthly losses to about 4%. However, despite the brief recovery, the token’s value is still down more than 40% in the past three months, indicating that the overall downward trend is not really over.
This price increase does look significant, but a number of technical indicators suggest that this move may only be a short-term bounce within a larger bearish trend-unless Pi Network manages to break an important resistance level that is key to a reversal.
Then, how will the Pi Network price move today?
Pi Network Price Drops 3.5% within 24 Hours
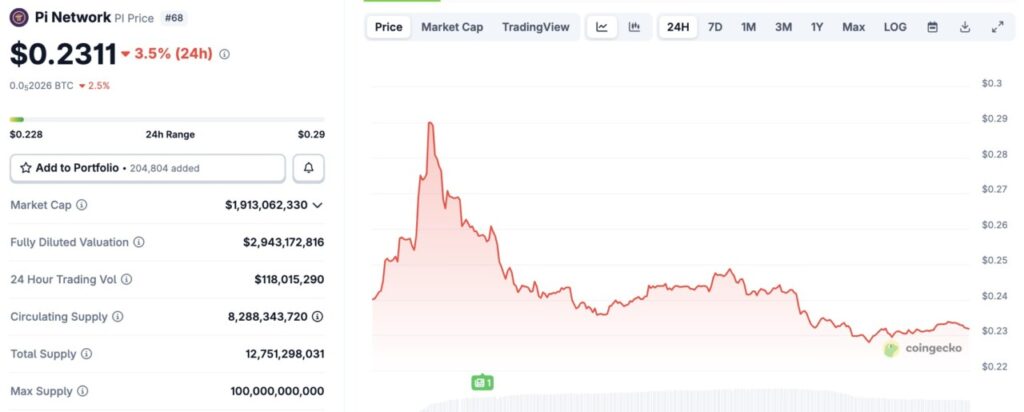
On October 28, 2025, the price of Pi Network was recorded at $0.2311, a decrease of 3.5% in 24 hours. If converted to the current rupiah ($1 = IDR 16,606), then 1 Pi Network is IDR 3,837.
Read also: Dogecoin Price Plunges 4% Today: Support Level $0.18 is the Key to DOGE Movement
Throughout the day, the price moved within a range of $0.228 to $0.29, showing considerable volatility. This drop came as the exchange rate against Bitcoin (BTC) fell by 2.5%, with 1 PI now equivalent to 0.00005206 BTC.
In terms of fundamentals, Pi Network’s market capitalization stands at $1.91 billion, while its fully diluted valuation stands at almost $2.94 billion. Market activity is also high, with 24-hour trading volumes topping $118 million.
Buying Momentum Starts to Weaken Despite Soaring Prices
The Pi Coin (PI) price did show a sharp recovery (10/27), but a number of technical indicators suggest that the fundamental forces behind this rally may not be strong enough to sustain it in the long term.
Between October 6 and October 27, PI prices formed lower highs, while the Relative Strength Index (RSI) indicator – which measures buying and selling strength – printed higher highs.
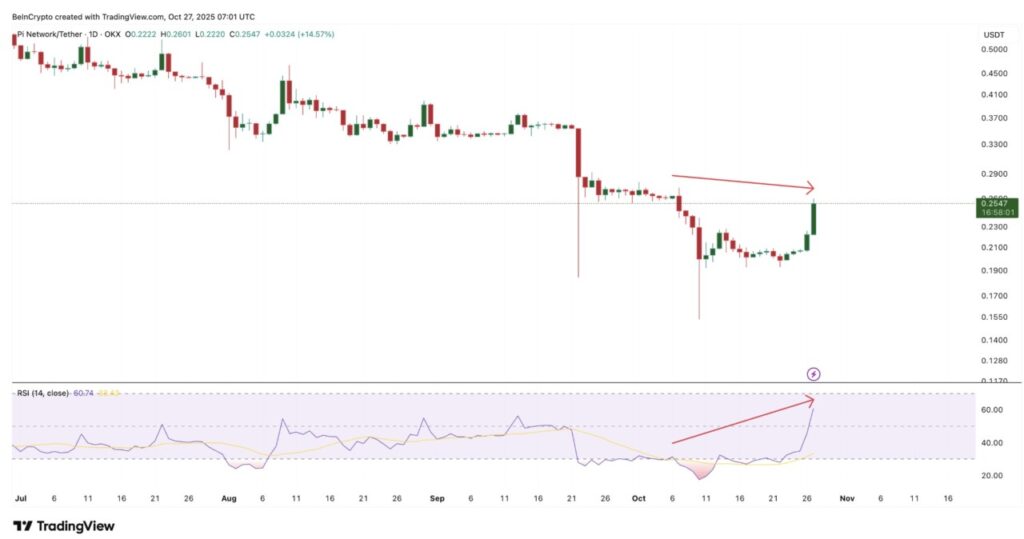
This pattern is known as a hidden bearish divergence, which is usually a signal that the long-term downward trend could still potentially continue, even though prices appear to be rising in the short-term. This means that the current price surge may be occurring on top of a market structure that is still weak.
Another technical indicator, the Money Flow Index (MFI) which monitors capital inflows into the market, is also showing similar signals. Since October 24, PI prices have been printing higher peaks, but the MFI has been declining – indicating that the amount of new funds entering the market is decreasing, even though prices continue to rise.
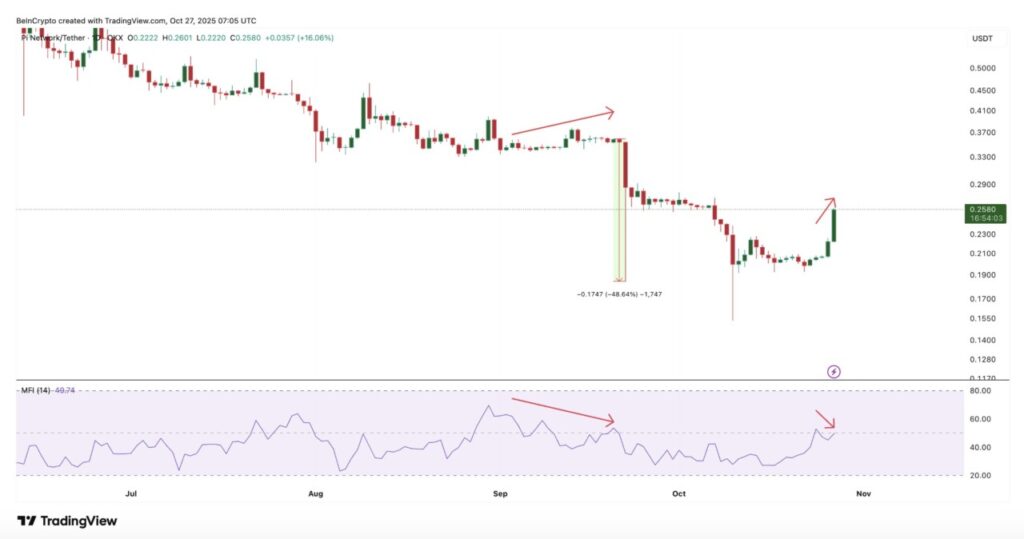
A combination of this pattern also occurred between September 3 and 20, which was followed by a 48% drop in PI prices shortly after. While there is no guarantee that a similar occurrence will happen again, this pattern indicates that the current rally is at risk of losing steam if buying pressure starts to weaken.
Upside Opportunities Still Open in the Short Term
Despite the bearish divergence signal, the short-term trend still shows room for further upside.
Read also: Ethereum Price Drops 3% Today: Can ETH Reach $4,500 by the End of 2025?
On the 4-hour chart (10/27), the 20-period Exponential Moving Average (EMA), which is more responsive to recent price movements, has crossed the 50-period EMA from bottom to top. This is often considered a short-term bullish signal, indicating upward momentum is starting to build.
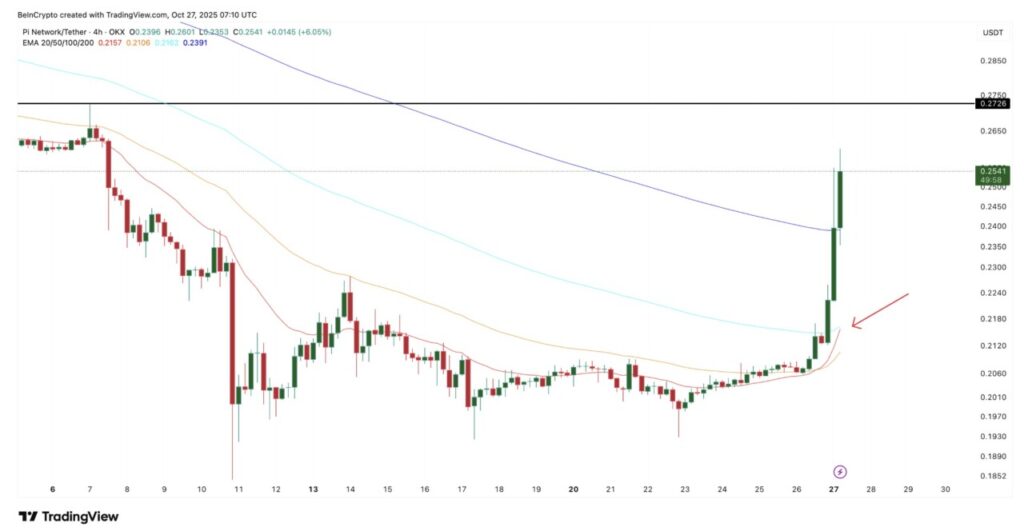
Currently, the 20 EMA is also approaching the 100-period EMA. If it manages to surpass the 100-period EMA, it could trigger another wave of buying, as this kind of crossover often marks the beginning of short-term long position formation by traders after prices rebound.
If this scenario occurs, the price of Pi Coin could potentially rise towards the nearest resistance level at $0.27.
Key Resistance Levels Will Determine the Next Direction of Pi Network Price
On the daily chart (10/27), Pi Coin is still moving inside a falling broadening wedge pattern-a technical formation that generally signals a potential bullish reversal. This pattern often forms during prolonged downtrends and can be a signal that selling pressure is starting to weaken.
Currently, the price of Pi Coin is testing the crucial resistance zone at $0.28. Although the short-term chart shows a potential rise towards $0.27, a stronger rise will only occur if the price is able to break and hold above $0.28.
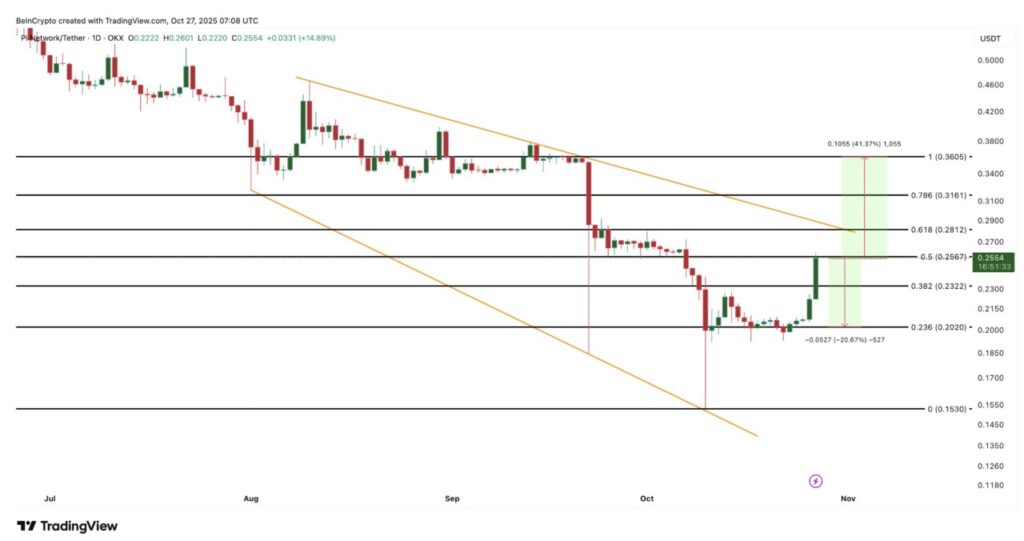
If the daily candle manages to close above that level, it will confirm the breakout of the wedge pattern, and open up further upside opportunities towards $0.36-about 41% higher than current levels.
However, if it fails to break this resistance, selling pressure could return quickly. A drop below $0.20 (down 20%) would leave PI prices vulnerable to further declines down to $0.15.
That’s the latest information about crypto. Follow us on Google News to get the latest crypto news about crypto projects and blockchain technology. Also, learn crypto from scratch with complete discussion through Pintu Academy and stay up-to-date with the latest crypto market such as bitcoin price today, xrp coin price today, dogecoin and other crypto asset prices through Pintu Market.
Enjoy an easy and secure crypto trading experience by downloading Pintu crypto app via Google Play Store or App Store now. Also, get a web trading experience with various advanced trading tools such as pro charting, various types of order types, and portfolio tracker only at Pintu Pro.
*Disclaimer
This content aims to enrich readers’ information. Pintu collects this information from various relevant sources and is not influenced by outside parties. Note that an asset’s past performance does not determine its projected future performance. Crypto trading activities have high risk and volatility, always do your own research and use cold cash before investing. All activities of buying and selling bitcoin and other crypto asset investments are the responsibility of the reader.
Reference:
- BeInCrypto. Pi Coin Is Pumping – Price Rally Could Extend If This Key Breakout Holds. Accessed on October 28, 2025
Latest News
© 2026 PT Pintu Kemana Saja. All Rights Reserved.
The trading of crypto assets is carried out by PT Pintu Kemana Saja, a licensed and regulated Digital Financial Asset Trader supervised by the Financial Services Authority (OJK), and a member of PT Central Finansial X (CFX) and PT Kliring Komoditi Indonesia (KKI). Crypto asset trading is a high-risk activity. PT Pintu Kemana Saja do not provide any investment and/or crypto asset product recommendations. Users are responsible for thoroughly understanding all aspects related to crypto asset trading (including associated risks) and the use of the application. All decisions related to crypto asset and/or crypto asset futures contract trading are made independently by the user.