USDT Dominance Predicted to Fall, Analysts Say Early Altseason Signals Begin to Appear!
Jakarta, Pintu News – A crypto analyst named Mr. Donald Dump shared the latest technical readings regarding the movement of the USDT Dominance (USDT.D) chart, an indicator often used to predict capital flows in the crypto market.
According to the analyst, USDT.D is currently at 5.38%, a position that is considered quite high and could potentially initiate a downward phase towards the 2.4%-2.6% area. If such a scenario materializes, capital rotation from stablecoins towards assets like Bitcoin (BTC) and altcoins could increase, which has historically been the trigger for large-scale alt seasons.
USDT Dominance as an Indicator of Market Capital Flows
USDT Dominance (USDT.D) represents the percentage of the total crypto market value that is held in the form of the stablecoin Tether (USDT). When this indicator rises, it suggests that market participants are holding their funds in the form of the stablecoin to wait for a specific moment.
Conversely, when USDT.D has declined, the funds have usually started to flow back into assets such as Bitcoin (BTC) and altcoins, fueling price growth in these assets.
Mr. Donald Dump explained that USDT.D’s up-and-down dynamics are often one of the early readings before major capital rotations in the crypto market begin. The chart he shared shows a complex wave pattern as well as the formation of an ABCDE pattern, which according to him could lead to a final drop in the indicator.
Read also: Altcoins Strengthen as Bitcoin Weakens, Signaling the Beginning of Altseason?
USDT.D Movement Projections According to Analysts
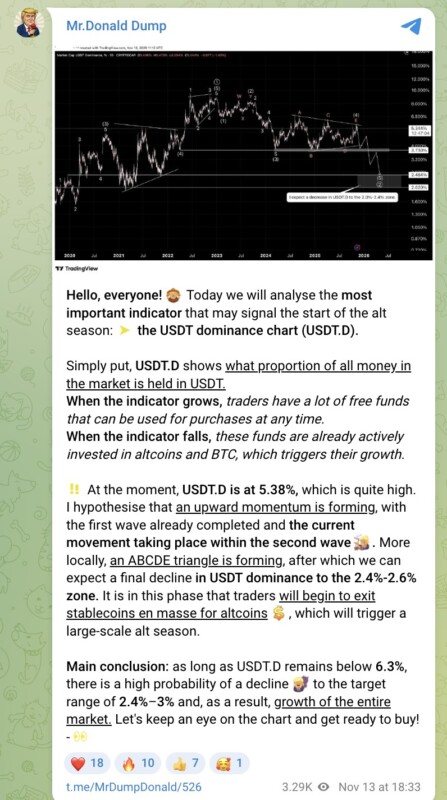
In his analysis, Mr. Donald Dump suggests that USDT.D is currently in the second wave phase of a larger technical structure. He argues that an ABCDE triangle pattern is forming, which is generally the final signal before further declines occur. The final downside target mentioned is in the range of 2.4%-3%, an area that historically reflects market conditions ready to enter an expansion phase.
According to the analyst, as long as USDT.D does not break the 6.3% level, the probability of heading towards the downside target remains high. He believes that this decline will be the phase when many market participants exit stablecoins and begin to enter altcoins in large numbers.
Also read: 3 Latest Bitcoin Price Analysis from Analyst Merlijn The Trader at X
Potential Impact on Crypto Market
If these projections are realized, USDT.D’s decline could open up opportunities for broader crypto asset growth. A decline in stablecoin dominance is usually an indicator that market participants are starting to increase exposure to higher-risk assets.
Historically, phases like this are often associated with the emergence of alt seasons, which are periods when altcoins outperform Bitcoin (BTC) in market performance.
Mr. Donald Dump concluded his analysis by emphasizing that the current movement of USDT.D is still worth monitoring, given that the technical patterns formed indicate the potential for major changes in the crypto market structure.
Conclusion
The latest analysis from Mr. Donald Dump highlights the importance of monitoring the USDT Dominance indicator as an early signal of large capital movements in the crypto market. With the indicator currently at 5.38% and technical patterns pointing to a potential further decline, the market is considered to be entering an important phase that could determine the direction of altcoins in the coming time.
FAQ
What is USDT Dominance (USDT.D)?
USDT Dominance is an indicator that shows the percentage of funds in the crypto market that are held in the stablecoin Tether (USDT). An increase in USDT.D indicates an increase in funds held, while a decrease in it indicates the flow of funds to assets such as Bitcoin (BTC) and altcoins.
Who provided this analysis of USDT Dominance?
The analysis was provided by Mr. Donald Dump, a crypto analyst who shares technical insights through his community channel.
When was this analysis published?
The analysis was published on November 13, 2025, based on USDT Dominance chart data updated on that date.
Where can the predicted indicators of decline be seen?
The downside prediction is seen on the USDT.D chart which shows a potential move towards the 2.4%-2.6% area, a technical region that analysts highlight as a correction target.
Why is the USDT.D drop considered important for the crypto market?
A drop in USDT.D often signals that funds are starting to exit the stablecoin and flow into other crypto assets, which can trigger broader market growth.
That’s the latest information about crypto. Follow us on Google News to get the latest crypto news about crypto projects and blockchain technology. Also, learn crypto from scratch with complete discussion through Pintu Academy and stay up-to-date with the latest crypto market such as bitcoin price today, xrp coin price today, dogecoin and other crypto asset prices through Pintu Market.
Enjoy an easy and secure crypto trading experience by downloading Pintu crypto app through Google Play Store or App Store now. Also, get a web trading experience with various advanced trading tools such as pro charting, various types of order types, and portfolio tracker only at Pintu Pro.
*Disclaimer
This content aims to enrich readers’ information. Pintu collects this information from various relevant sources and is not influenced by outside parties. Note that an asset’s past performance does not determine its projected future performance. Trading crypto carries high risk and volatility, always do your own research and use cold hard cash before investing. All activities of buying and selling bitcoin and other crypto asset investments are the responsibility of the reader.
Reference:
Latest News
© 2026 PT Pintu Kemana Saja. All Rights Reserved.
The trading of crypto assets is carried out by PT Pintu Kemana Saja, a licensed and regulated Digital Financial Asset Trader supervised by the Financial Services Authority (OJK), and a member of PT Central Finansial X (CFX) and PT Kliring Komoditi Indonesia (KKI). Crypto asset trading is a high-risk activity. PT Pintu Kemana Saja do not provide any investment and/or crypto asset product recommendations. Users are responsible for thoroughly understanding all aspects related to crypto asset trading (including associated risks) and the use of the application. All decisions related to crypto asset and/or crypto asset futures contract trading are made independently by the user.