3 RWA Crypto Tokens Showing Strong Momentum in Early December 2025
Jakarta, Pintu News – The real-world asset (RWA) market is recovering after a slowdown in November, driven by renewed interest from stablecoin experiments and strong technical setups.
Although activity in the sector is still uneven, some charts show clearer movement patterns than others.
In early December, there were three major RWA tokens worth keeping an eye on. Each showed a different combination of trend strength, recovery potential, and risk level, citing a BeInCrypto report.
Stellar (XLM)
Among the noteworthy Real-World Asset (RWA) tokens in early December, Stellar (XLM) stands out as a payment network that is actually used by major financial players.
Read also: 4 Catalysts that Could Push Solana Prices Up to 80%
Although performance throughout November was still tough with a decline of around 18.9%, in the last seven days XLM recorded a 4.9% rebound. This increase was driven by US Bank’s trial of the stablecoin and increased AUDD activity, which drew attention back to the Stellar network.
Technically, XLM is slowly forming a trend reversal pattern. Between November 4 and 21, the price printed lower lows, but the Relative Strength Index (RSI) formed higher lows.
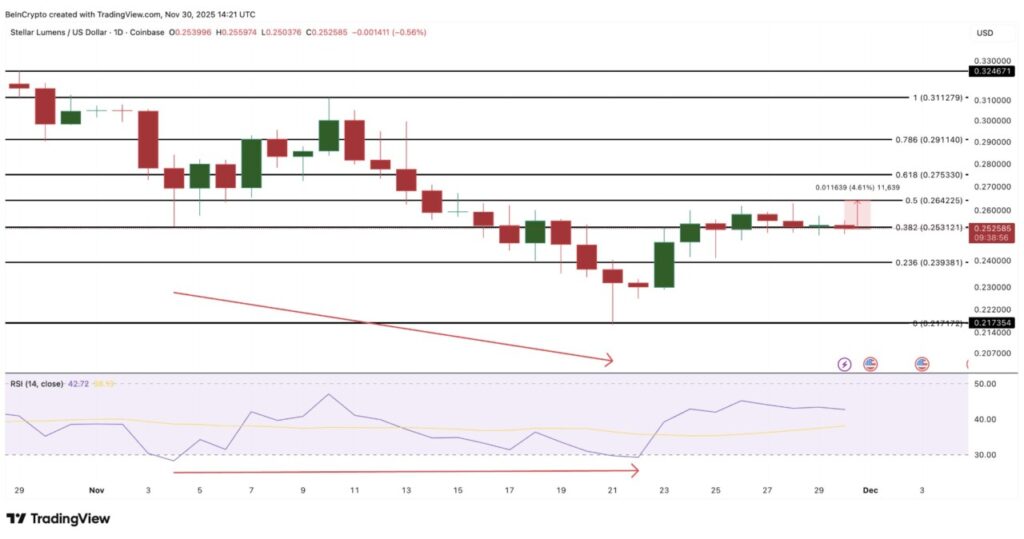
The RSI-which measures the strength of momentum on a scale of 0-100-shows a “price down, RSI up” pattern, or what is commonly known as a bullish divergence. This is often an early signal that selling pressure is starting to weaken behind the scenes.
The rebound started immediately after the signal appeared, but XLM is still stuck in a narrow range between $0.253 to $0.264. A clear daily close above $0.264 would be a confirmation that buyer power (bulls) are starting to take control of the market.
If that happens, the next target area to watch would be $0.275, and then $0.324, especially if the general market conditions also improve. However, if XLM prices instead drop below $0.239, then this bullish pattern will weaken and a possible correction could continue down to $0.217, which would delay the RWA recovery narrative further.
Quant (QNT)
Quant (QNT) is the most glaring outlier among Real-World Asset (RWA) tokens at the moment. While most RWA assets were under pressure throughout November, QNT went in the opposite direction.
Over the course of November, QNT has gained around 32%, and even recorded a surge of around 37% in just the last seven days. In early December alone, the token added another 12%, making it one of the strongest charts in the RWA segment right now.
Quant is at the center of the “interoperability for finance” narrative, thanks to Overledger’s technology that connects public and private blockchains. As such, QNT often reacts earlier to increased institutional demand than other RWA tokens.
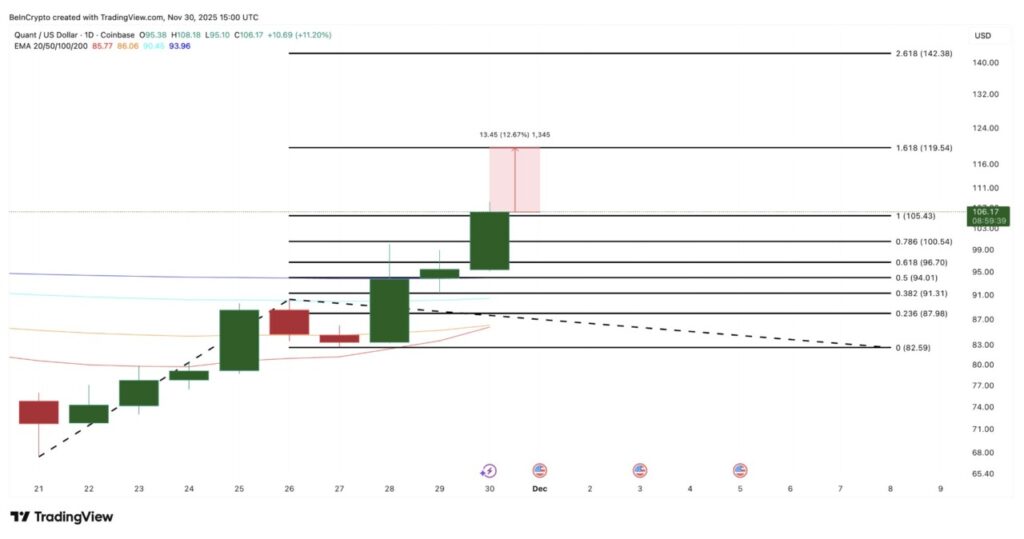
Technically, momentum continues to build. QNT almost formed a bullish EMA crossover pattern on the daily chart, where the 20-day EMA almost crossed above the 50-day EMA. This pattern is usually a signal that buyers are starting to take control of the market. If this crossover actually happens, QNT has the potential for a further price surge.
Note that the EMA (Exponential Moving Average) is a trend line that gives more weight to recent prices, helping traders to observe short-term momentum more clearly.
The first level that needs to be broken is $119, which coincides with the 1.618 Fibonacci extension level. If the buying pressure remains strong, then $142 becomes the next big resistance target.
But on the downside, $100 is the initial support level to watch. If this level is broken, QNT prices could correct to $91 or even $87. The medium-term bullish structure will only be broken if the price drops below $82, the point where the current uptrend is no longer valid.
Read also: Quant Crypto Price: QNT Plunges 11% Due to Market Correction – Will the Bullish Trend Last?
For now, Quant remains the most resilient token in the RWA group and carries the strongest momentum in early December.
Ondo (ONDO)
Ondo (ONDO) is in quite an interesting position among the list of major Real-World Asset (RWA) tokens. In the last seven days, ONDO is up about 9.3%, but overall it is still one of the weakest performers in the last 30 days with a decline of about 25%.
Interest in the token increased this week after a post mentioned that Ondo Finance is planning to expand its tokenization of US stocks and ETFs to the European region. If this direction does materialize, it could strengthen Ondo’s position in the overall RWA ecosystem-and of course, potentially influence price movements.
This uncertainty is reflected in the chart. Since November 21, ONDO has been on a steady rebound, but the more important technical development is seen in the OBV (On-Balance Volume) indicator.
OBV is an indicator that measures whether buying volume is more dominant than selling volume over time. In ONDO’s case, the OBV has broken the downtrend line that has been in place since early November.
This breakout occurred while the price was still moving sideways in the range of $0.50 to $0.54 since November 27. This indicates that there may be a stealth accumulation process going on behind the scenes.
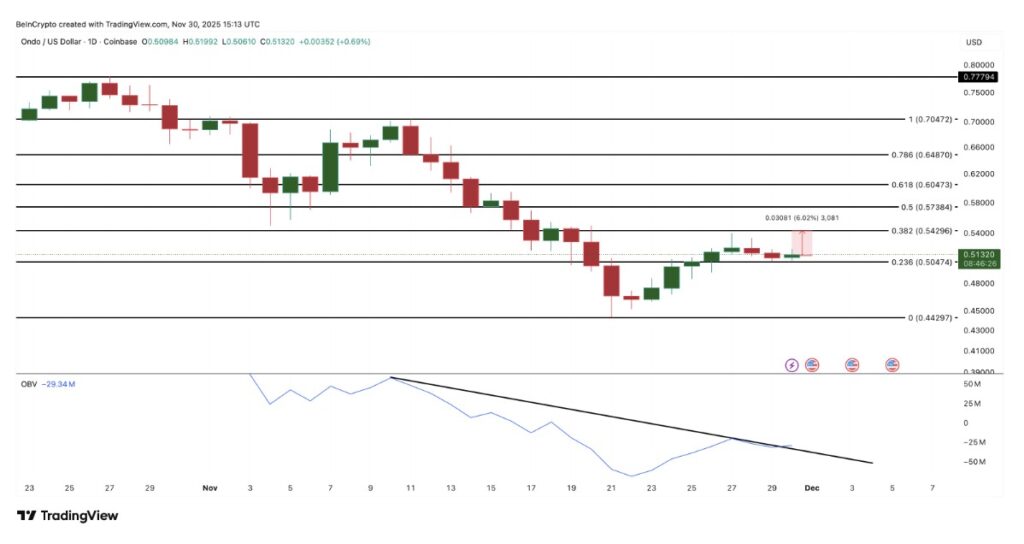
For confirmation of an upside move, a clean daily close above $0.54 is an important first step-about 6% above the current price. If this level is successfully broken, the next upside target is at $0.60, and if the market is favorable, ONDO could proceed to $0.70.
However, if the OBV fails to hold above the breakout line and drops back, this move could be a fake-out. In this scenario, the probability of prices falling below $0.50 increases, with the next important support at around $0.44.
Among other RWA tokens, ONDO has the most balanced setup-capable of going higher if accumulation continues, but also vulnerable to decline if technical signals start to weaken again.
That’s the latest information about crypto. Follow us on Google News to get the latest crypto news about crypto projects and blockchain technology. Also, learn crypto from scratch with complete discussion through Pintu Academy and stay up-to-date with the latest crypto market such as bitcoin price today, xrp coin price today, dogecoin and other crypto asset prices through Pintu Market.
Enjoy an easy and secure crypto trading experience by downloading Pintu crypto app via Google Play Store or App Store now. Also, get a web trading experience with various advanced trading tools such as pro charting, various types of order types, and portfolio tracker only at Pintu Pro.
*Disclaimer
This content aims to enrich readers’ information. Pintu collects this information from various relevant sources and is not influenced by outside parties. Note that an asset’s past performance does not determine its projected future performance. Crypto trading activities have high risk and volatility, always do your own research and use cold cash before investing. All activities of buying and selling bitcoin and other crypto asset investments are the responsibility of the reader.
Reference:
- BeInCrypto. 3 Real World Assets (RWA) Tokens To Watch In December 2025. Accessed on December 5, 2025
Latest News
© 2026 PT Pintu Kemana Saja. All Rights Reserved.
The trading of crypto assets is carried out by PT Pintu Kemana Saja, a licensed and regulated Digital Financial Asset Trader supervised by the Financial Services Authority (OJK), and a member of PT Central Finansial X (CFX) and PT Kliring Komoditi Indonesia (KKI). Crypto asset trading is a high-risk activity. PT Pintu Kemana Saja do not provide any investment and/or crypto asset product recommendations. Users are responsible for thoroughly understanding all aspects related to crypto asset trading (including associated risks) and the use of the application. All decisions related to crypto asset and/or crypto asset futures contract trading are made independently by the user.