Solana Price Drops 55% from All-Time High — How Much Further Could It Fall?
Jakarta, Pintu News – Solana (SOL) is under heavy selling pressure again, and traders everywhere are wondering why the price of SOL is dropping so drastically, even as other large-cap altcoins begin to show signs of stabilizing.
Currently, the SOL has plummeted by 57% from its all-time high and is now right at its most important long-term support zone. If this support is broken, the impact could be very serious. This is the signal that the next chart shows.
Why is SOL price falling?
Solana’s weekly chart shows that its price has fallen 57% from its all-time high of $295.83 back in January. After reaching its peak, SOL fell back into its old price range of between $120 and $250 – a zone that has been the area of price movement for almost two years.
Read also: XRP Price on the Brink of Collapse, But There’s Rare Hope from On-Chain Data!
This range is very important. Steady price movements above or below this zone can signal a major trend change, not just regular fluctuations.
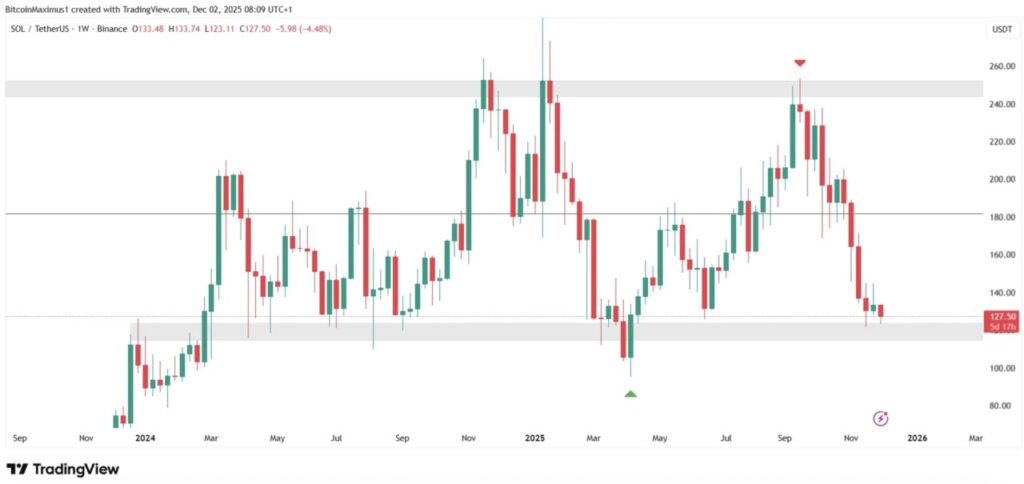
Currently, the chart shows continued downward pressure. On December 2, SOL was trading at the horizontal support area of $120. If this level is broken, the price has the potential to drop another 50% as there is no strong support below it.
Traders are watching closely, because if Solana loses this zone, then the long-term trend officially turns bearish (downtrend).
Solana’s Crash is Getting Closer
The momentum indicator is showing a stronger bearish signal than the current price action.
- There was a bearish divergence on the Relative Strength Index (RSI) indicator.
- Bearish divergence is also seen on the Moving Average Convergence/Divergence (MACD).
- The RSI has broken the trend line and dropped below the 50 level.
- MACD is now in the negative zone.
Combined with the price movement, all these signs point to a high probability of a continued decline.
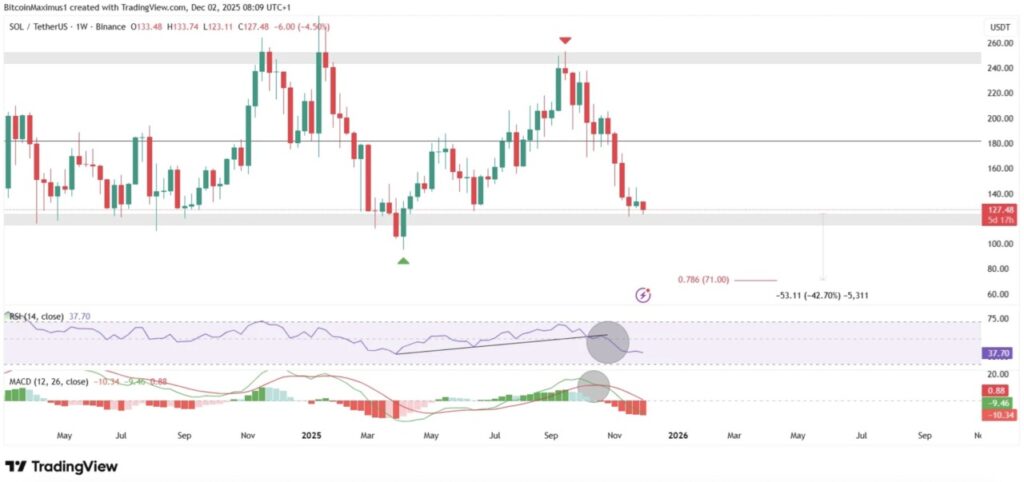
If this bearish pattern is fully confirmed, the next major support level is at the Fibonacci retracement of 0.786, around $71 – which means SOL prices could still drop by around 40% more.
Solana Price Prediction in December
Even the daily chart shows no sign of recovery. Solana’s downward trend is still locked in a downward resistance trend line pattern.
Read also: Bitcoin Price Crawls Up to $92,000 Today: BTC Still at Risk of Decline?
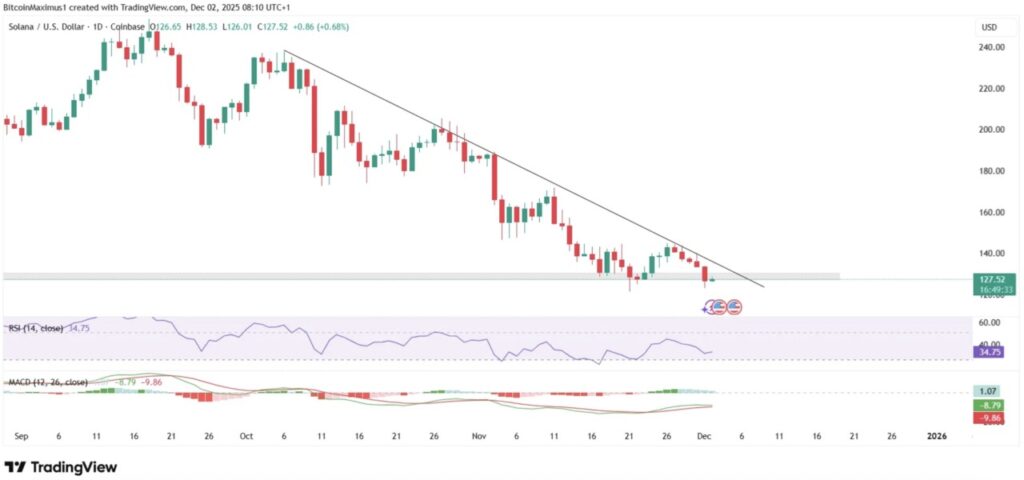
The chart shows the latest rejection (red icon), which triggered a break below the minor support at the $125 level. With no bullish signals from either RSI or MACD, the direction of the trend going forward is becoming increasingly clear: Solana will most likely continue to fall.
The Decline Continues
Currently, Solana is at a crucial point – either bounce back or fall deeper. If the price manages to bounce strongly above the $120 level, the decline might be delayed. But if it fails to hold this level, SOL will most likely fall towards $70.
As long as there is no momentum reversal or the emergence of a strong divergence, the trend remains clear: bearish. For now, the reason why SOL prices continue to fall is very simple: the market is dominated by selling pressure (bearish), and there is no support level strong enough to hold it.
That’s the latest information about crypto. Follow us on Google News to get the latest crypto news about crypto projects and blockchain technology. Also, learn crypto from scratch with complete discussion through Pintu Academy and stay up-to-date with the latest crypto market such as bitcoin price today, xrp coin price today, dogecoin and other crypto asset prices through Pintu Market.
Enjoy an easy and secure crypto trading experience by downloading Pintu crypto app via Google Play Store or App Store now. Also, get a web trading experience with various advanced trading tools such as pro charting, various types of order types, and portfolio tracker only at Pintu Pro.
*Disclaimer
This content aims to enrich readers’ information. Pintu collects this information from various relevant sources and is not influenced by outside parties. Note that an asset’s past performance does not determine its projected future performance. Crypto trading activities have high risk and volatility, always do your own research and use cold cash before investing. All activities of buying and selling bitcoin and other crypto asset investments are the responsibility of the reader.
Reference:
- CCN. Solana (SOL) Price Plummets 55% Since All-Time High – How Much Further Until it Bottoms? Accessed on December 3, 2025
Latest News
© 2026 PT Pintu Kemana Saja. All Rights Reserved.
The trading of crypto assets is carried out by PT Pintu Kemana Saja, a licensed and regulated Digital Financial Asset Trader supervised by the Financial Services Authority (OJK), and a member of PT Central Finansial X (CFX) and PT Kliring Komoditi Indonesia (KKI). Crypto asset trading is a high-risk activity. PT Pintu Kemana Saja do not provide any investment and/or crypto asset product recommendations. Users are responsible for thoroughly understanding all aspects related to crypto asset trading (including associated risks) and the use of the application. All decisions related to crypto asset and/or crypto asset futures contract trading are made independently by the user.