Bitcoin Getting Ready to Surge? BTC price could reach $107,000!
Jakarta, Pintu News – Bitcoin is currently at an important crossroads, with the potential to surge or fall depending on the next price movement. Tight market conditions between buyers and sellers are adding to the tension, with all eyes on the critical zone that will determine the next direction.
Recovery Scenario: Return to Pink Zone and Declining Trendline
Kamile Uray noted that Bitcoin (BTC) failed to hold above the $90,720 level in the hourly chart, which triggered the anticipated decline. Currently, the first support is at $87,644, with deeper support between $83,822 and $82,477. If this zone is successfully defended by buyers, Bitcoin might try to climb back to the pink box region and test the descending trend line above it.
According to Uray, if Bitcoin can hold above the pink box resistance in the daily time frame, it will open up opportunities to challenge the descending blue trend line. A confirmed breakout from this area could strengthen the bullish momentum, pushing the price towards the next resistance levels at $98,200 and $107,500. A break above $107,500 along with the descending trend line would be a strong signal that the broader uptrend is ready to resume.
Also Read: 5 Important Facts from Bitcoin’s (BTC) Latest Prediction: US$125,000 Target?
Bitcoin Price Rejection in the $93,000-$95,000 Zone
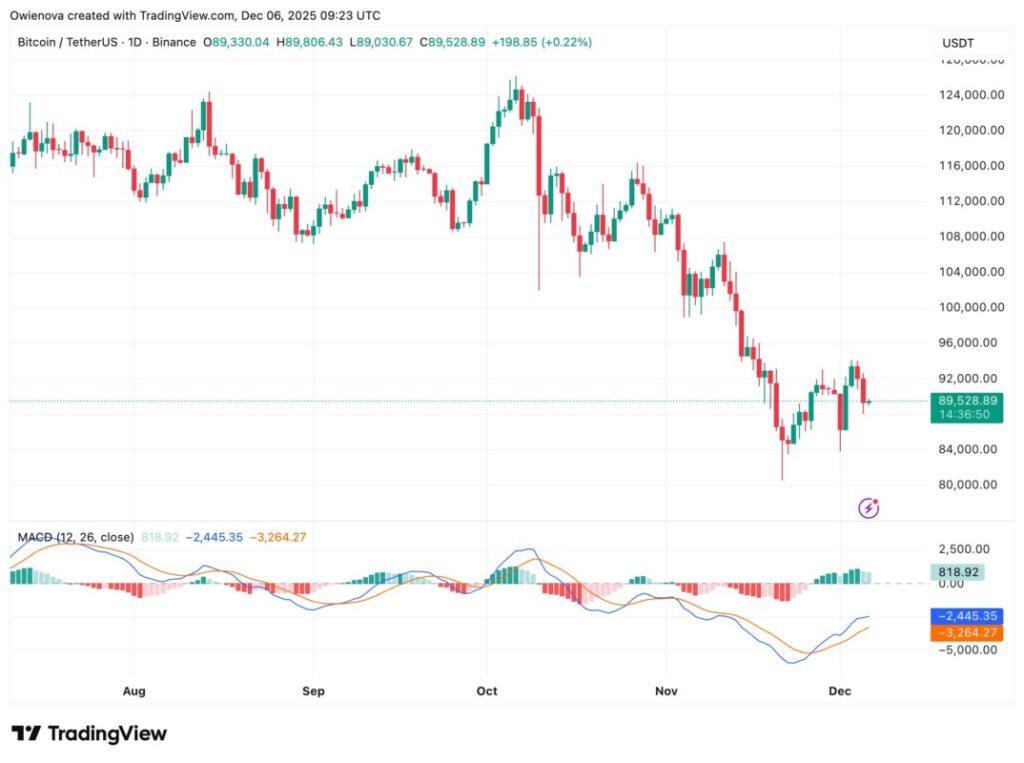
Crypto Candy revealed that Bitcoin’s latest price action has unfolded in line with expectations. After experiencing rejection at the $93,000-$95,000 resistance zone, BTC experienced a sharp decline and almost touched the anticipated support range of $86,000-$87,500.
This move reflects the broader market reaction to the strong selling pressure near the upper resistance band. The $86,000-$87,500 zone is now a crucial pivot area. If buyers manage to hold this support and prices stabilize above it, Bitcoin might revisit the $93,000-$95,000 range, or even push further.
Such a rebound would signal renewed bullish momentum and set the stage for another attempt at breaking higher resistance levels.
Downside Potential: Risk If Support Fails
However, Uray warned that a daily close below $82,477 would shift the market structure towards further weakness, putting Bitcoin at risk of visiting lower levels. Nonetheless, Uray highlighted one critical area of strength: the $74,496-$71,237 zone.
This region represents the key breakout peak from November 2024 and is considered strong historical support. In this area, buyers might enter aggressively, potentially setting the stage for an upward reversal.
Conclusion
With tight market conditions and great potential for significant price movements, investors and market watchers should constantly monitor these key levels. Decisions to buy or sell should be based on careful technical analysis and a deep understanding of current market dynamics.
Also Read: 10 Ways to Learn Crypto from Zero: Basic Guide to Start Investing Safely
Follow us on Google News to get the latest information about crypto and blockchain technology. Check Bitcoin price today, Solana price today, Pepe coin and other crypto asset prices through Pintu Market.
Enjoy an easy and secure crypto trading experience by downloading Pintu crypto app via Google Play Store or App Store now. Also, get a web trading experience with various advanced trading tools such as pro charting, various types of order types, and portfolio tracker only at Pintu Pro.
*Disclaimer
This content aims to enrich readers’ information. Pintu collects this information from various relevant sources and is not influenced by outside parties. Note that an asset’s past performance does not determine its projected future performance. Crypto trading activities are subject to high risk and volatility, always do your own research and use cold hard cash before investing. All activities of buying andselling Bitcoin and other crypto asset investments are the responsibility of the reader.
FAQ
What are the most crucial price levels that analysts are observing in the current Bitcoin (BTC) movement?
According to Kamile Uray’s analysis, the levels of $87,644, $83,822, and $82,477 are the three closest areas of support that determine whether BTC can hold or continue its decline. These levels serve as a reference to read the strength of buyers in tight market conditions.
Why is the $93,000-$95,000 zone considered an important resistance area?
Crypto Candy explains that Bitcoin experiences significant rejection every time it touches the zone, indicating strong selling pressure from market participants. The reaction in this area determines whether BTC is able to build bullish momentum or correct again.
What are the key conditions for Bitcoin to potentially rise towards $98,200 to $107,500?
According to Uray, BTC should return to the pink box region, hold above it in the daily time frame, and break the downtrend line. If this breakthrough happens, the next resistance targets are at $98,200 and $107,500.
What is the biggest risk if Bitcoin falls below $82,477?
A daily close below that level would change the market structure to weak, opening up opportunities for further declines. Uray said that this scenario could drag the price towards the historical support between $74,496-$71,237.
What is the significance of the $74,496-$71,237 zone in technical analysis?
The zone is the November 2024 breakthrough peak which is considered strong structural support. If the price reaches this area, analysts expect buyers may appear more aggressive in maintaining the long-term trend.
How does the market react to selling pressure in the upper resistance area?
According to Crypto Candy, BTC’s rejection of the $93,000-$95,000 range shows dominant selling pressure whenever the price approaches the area. The market response in this zone helps determine whether the bullish momentum can recover or not.
What are the implications of market conditions described as “tight” today?
This indicates that the power between buyers and sellers is at a balance, so the next price movement is highly dependent on certain technical levels. This kind of uncertainty often leads to higher volatility.
Has a bullish signal formed on Bitcoin’s current movement?
Based on the analysis cited, the bullish signal is not yet fully formed as BTC has to break through an important resistance and maintain a position above it. Without confirmation of a breakthrough, the uptrend is not considered valid.
Why should investors monitor technical levels in this situation?
Technical levels such as support and resistance help identify tipping points that can trigger large movements, both up and down. Understanding the market structure helps investors assess risks and opportunities more accurately.
How does this affect investors’ strategic planning?
With a possible surge towards $107,000 or a drop towards $71,000, investors will need to adjust strategies based on price developments at key levels. Technical analysis is the basis for reading market momentum and direction in the short term.
Reference
- NewsBTC. Bitcoin’s Structure Tightens. Accessed on December 8, 2025
Latest News
© 2026 PT Pintu Kemana Saja. All Rights Reserved.
The trading of crypto assets is carried out by PT Pintu Kemana Saja, a licensed and regulated Digital Financial Asset Trader supervised by the Financial Services Authority (OJK), and a member of PT Central Finansial X (CFX) and PT Kliring Komoditi Indonesia (KKI). Crypto asset trading is a high-risk activity. PT Pintu Kemana Saja do not provide any investment and/or crypto asset product recommendations. Users are responsible for thoroughly understanding all aspects related to crypto asset trading (including associated risks) and the use of the application. All decisions related to crypto asset and/or crypto asset futures contract trading are made independently by the user.