Bitcoin Surges to $93,000 Today — A Look at BTC’s Technical Outlook
Jakarta, Pintu News – Bitcoin (BTC) continued its recovery trend in early January 2026, as buyers maintained higher price levels on the four-hour chart (5/1). Market data shows that BTC still maintains a short-term bullish structure after recovering from weakness in late December.
In addition to the price strengthening, metrics from the derivatives market and spot flows are now also supporting this recovery narrative. As a result, traders are now watching to see if Bitcoin is able to maintain its momentum around important resistance areas.
Then, how will the Bitcoin price move today?
Bitcoin Price Rises 0.85% in 24 Hours
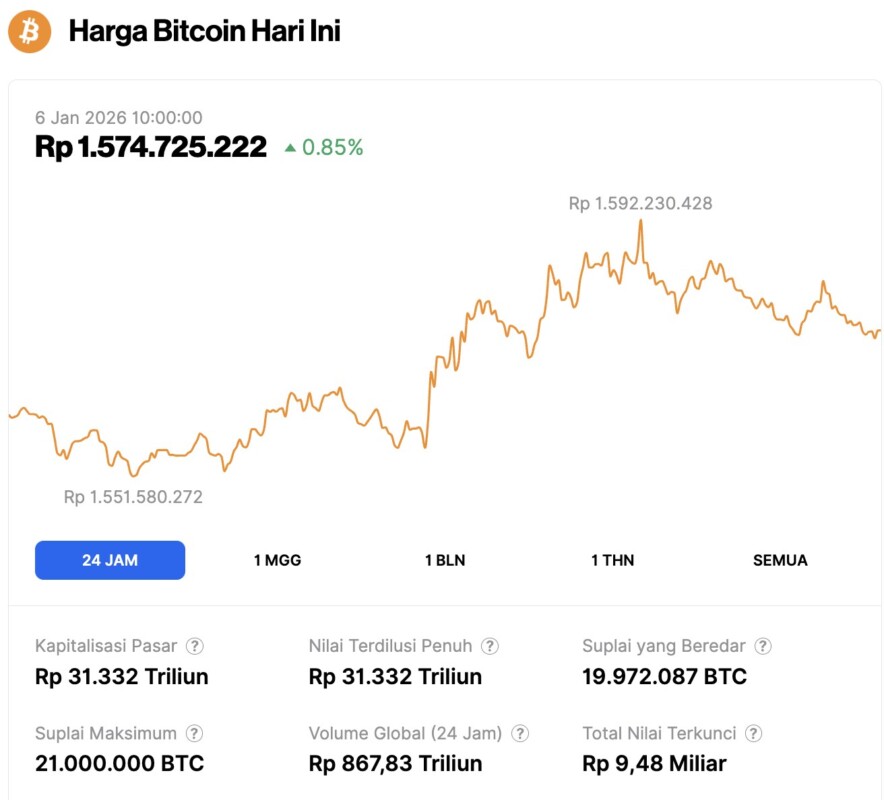
On January 6, 2026, Bitcoin was trading at $93,716, equivalent to IDR 1,574,725,222 — marking a 0.85% increase over the past 24 hours. During this time, BTC hit a low of IDR 1,551,580,272 and reached a high of IDR 1,592,230,428.
At the time of writing, Bitcoin’s market capitalization is approximately IDR 31,332 trillion, while its 24-hour trading volume has surged by 41% to IDR 867.83 trillion.
Read also: Analyst James Wynn Hints at Bullish Trend, Go Long After Bitcoin Breaks $93,000!
Short-Term Structure Shows Buyer Dominance
Bitcoin continues to post higher highs and higher lows on the four-hour time frame (5/1/26), signaling that buyers are back in control after the price broke back through the mid-Fibonacci level.
Also, the price is still holding above the bullish short-term moving averages, which reinforces the stability of the trend.
Currently, the market is approaching an area of solid resistance, where there is usually an increased market reaction. Therefore, traders expect there to be increased volatility as BTC tests the selling pressure above it.
The resistance Bitcoin faces is layered, rather than a single point. The first resistance is around $92,460, where the 0.786 Fibonacci retracement level meets.
Then, the $94,650 region is the previous swing high point that stopped the price increase. If the price is able to break this level consistently, it will most likely test the psychological zone at $95,000. However, in case of price rejection around the current level, the general bullish structure is still undisturbed.
On the downside, Bitcoin has some clear support levels that still support the bullish sentiment. The area between $90,700 to $90,400 is a combination of previous resistance and the exponential moving average that continues to rise.
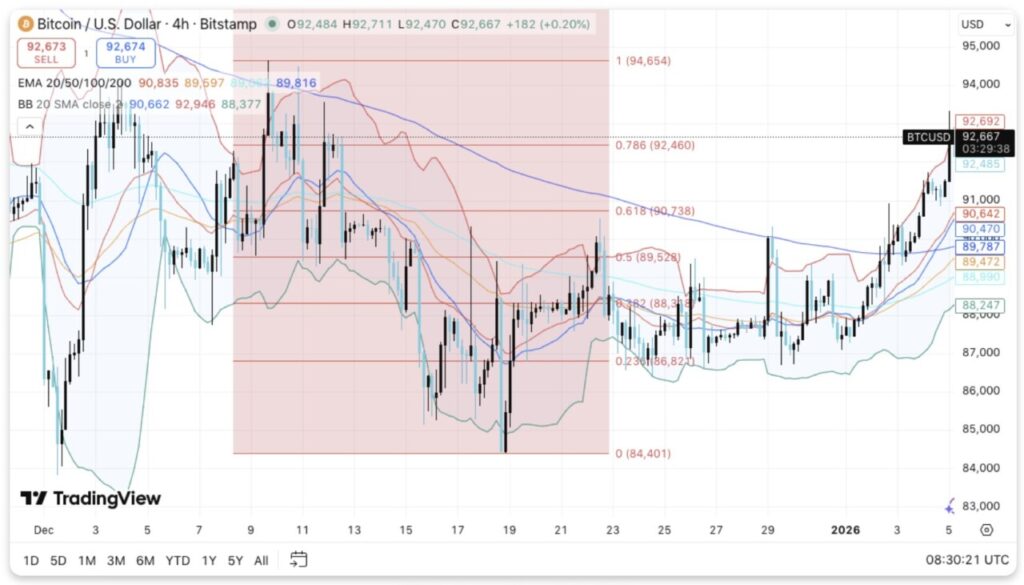
Moreover, the $89.500 level is also important as it coincides with the 0.5 Fibonacci retracement and part of the short-term structure. This zone is of major concern for momentum traders.
If $89.500 fails to hold, the market focus could shift to the $88.300 to $88.000 region, which was the previous breakdown area. If the selling pressure persists, the price could drop deeper to the lower range between $86,800 to $86,400. A drop below this area would invalidate the ongoing bullish scenario.
Read also: 3 Reasons Why Bitcoin Price Has Skyrocketed Amid US Military Operations in Venezuela
Derivatives and Spot Flow Data Provide Additional Context
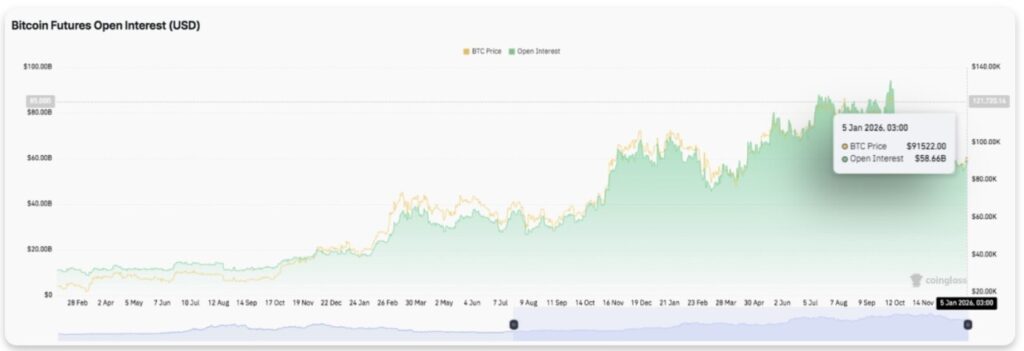
Data from the derivatives market shows that open interest (OI) in Bitcoin futures contracts increases as the price increases. This increase in open interest occurred consistently until early 2026, reflecting the growing participation of traders. Importantly, the increase was regular, not extreme or sudden.
This pattern indicates the accumulation of leverage without triggering excessive liquidation risk. The decrease in open interest is in line with the shallow price correction, indicating only routine position adjustments, not panic selling.
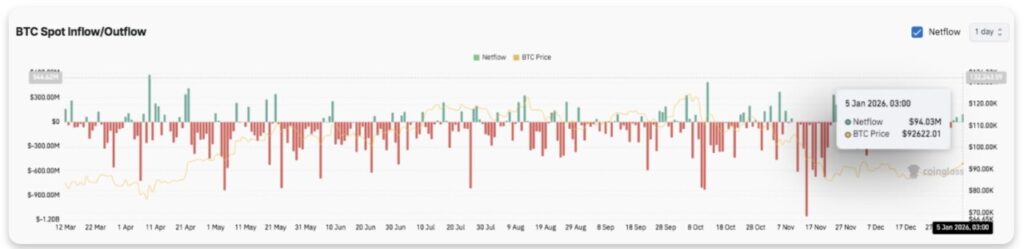
Meanwhile, spot flow data provides a more detailed picture. During the analysis period, outflows were predominant, which usually reflected distribution actions as prices rose. However, there were also inflows that appeared periodically in areas of consolidation.
Interestingly, in early January a positive netflow of around $94 million was recorded, indicating increased demand and reduced selling pressure. Thus, spot activity is now supporting price stability in the short term.
Bitcoin Price Technical Outlook
Important levels are still evident as Bitcoin price moves in a consolidation phase below a major resistance area.
For upside potential, levels to watch include:
- $92,460 as the first bottleneck,
- followed by $94.650, which was the previous swing high,
- and if it manages to break both, the price has the potential to continue to the psychological zone at $95,000, especially if the momentum strengthens.
On the downside, the closest support is at:
- $90.700 to $90.400, where the short-term exponential moving average (EMA) and previous resistance meet,
- then $89,500 becomes an important level as it aligns with the 0.5 Fibonacci retracement.
If the $89.500 level is unable to be maintained, the price risks dropping to $88.000, even deeper towards the lower range between $86.800 to $86.400.
Technically, Bitcoin is still consolidating in a consolidating structure, rather than forming a top. The EMAs are still bullishly arranged, while the Bollinger Bands hint at a potential expansion of volatility in the near future.
That’s the latest information about crypto. Follow us on Google News to get the latest crypto news about crypto projects and blockchain technology. Also, learn crypto from scratch with complete discussion through Pintu Academy and stay up-to-date with the latest crypto market such as bitcoin price today, xrp coin price today, dogecoin and other crypto asset prices through Pintu Market.
Enjoy an easy and secure crypto trading experience by downloading Pintu crypto app via Google Play Store or App Store now. Also, get a web trading experience with various advanced trading tools such as pro charting, various types of order types, and portfolio tracker only at Pintu Pro.
*Disclaimer
This content aims to enrich readers’ information. Pintu collects this information from various relevant sources and is not influenced by outside parties. Note that an asset’s past performance does not determine its projected future performance. Crypto trading activities have high risk and volatility, always do your own research and use cold cash before investing. All activities of buying and selling bitcoin and other crypto asset investments are the responsibility of the reader.
Reference:
- CoinEdition. Bitcoin Price Prediction: BTC Momentum Improves as Derivatives and Flows Stabilize. Accessed on January 6, 2026
Latest News
© 2026 PT Pintu Kemana Saja. All Rights Reserved.
The trading of crypto assets is carried out by PT Pintu Kemana Saja, a licensed and regulated Digital Financial Asset Trader supervised by the Financial Services Authority (OJK), and a member of PT Central Finansial X (CFX) and PT Kliring Komoditi Indonesia (KKI). Crypto asset trading is a high-risk activity. PT Pintu Kemana Saja do not provide any investment and/or crypto asset product recommendations. Users are responsible for thoroughly understanding all aspects related to crypto asset trading (including associated risks) and the use of the application. All decisions related to crypto asset and/or crypto asset futures contract trading are made independently by the user.