XRP Targets 34% Rally, But Mixed Demand Clouds the Outlook
Jakarta, Pintu News – XRP (XRP) has taken a dip after last week’s rally, but the structure behind its price movement is still showing positive signs.
A classic inverse head-and-shoulders pattern is starting to form, and if this pattern is successfully resolved as buying pressure increases, the upside potential for the price could be around 34%.
However, on-chain data shows that not all buyers act in the same way. Some accumulation activity favors potential breakouts, while other buying patterns pose risks in the short term.
The chances of a breakout do seem to exist, but the composition of market participants could determine whether the price of XRP will break out smoothly or be held back.
Chart Structure Still Supports Breakout Attempt
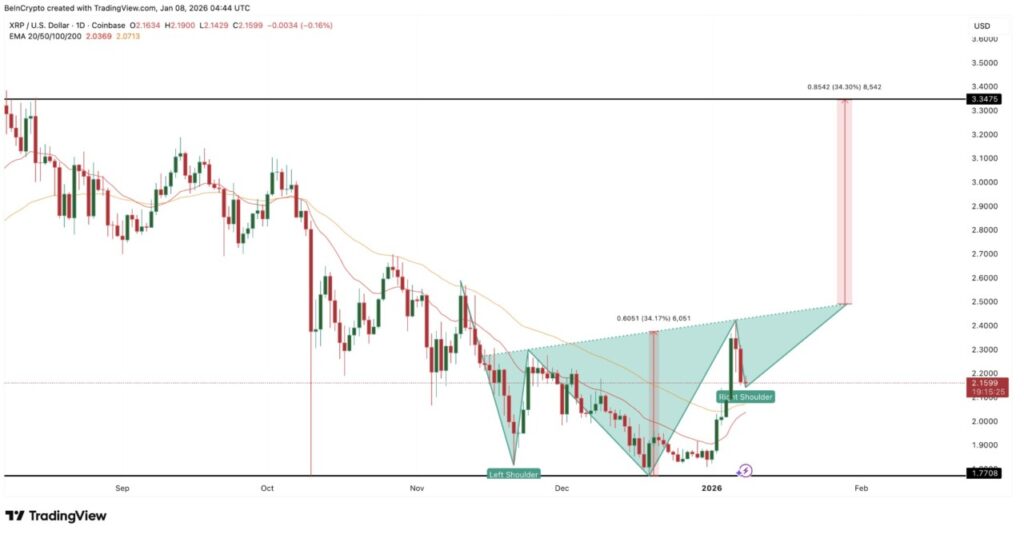
XRP’s recent price drop seems to be forming the right shoulder portion of an inverse head-and-shoulders pattern. This pattern appears when selling pressure starts to weaken after a deep decline, and buyers slowly start to take control.
Read also: XRP vs Solana Performance Prediction: Which is Superior in January 2026?
As long as the price remains above $1.77, this pattern is still considered valid. If the price manages to break theneckline, the upside target could be around 34%, approaching the $3.34 level.
One of the supporting technical factors is the formation of a signal known as the golden crossover, where the 20-day exponential moving average (EMA) begins to approach the 50-day EMA.
Note that the exponential moving average (EMA) gives more weight to recent prices, making it more responsive to trend changes than the simple moving average (SMA).
When the short-term EMA crosses above the long-term EMA, it is often considered a signal of improving momentum and stabilizing the trend. This crossover is forming while XRP is in a consolidation phase, which usually favors a continuation of the uptrend rather than a decline.
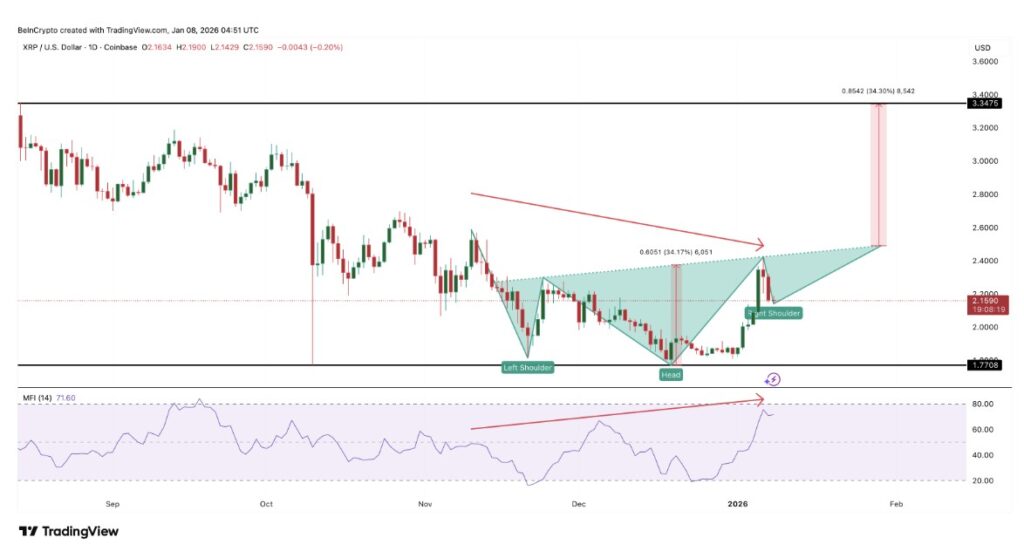
Momentum data also supports this view. TheMoney Flow Index ( MFI), which measures the flow of money in and out of an asset, showed an upward trend even though prices have been declining since early November.
This indicates that falling prices consistently attract buying interest. In short, demand continues to build quietly behind the scenes, even when prices are falling.
Whale Accumulation Supports Price, but the Timing is Decisive
On-chain data shows that two large groups of holders(whales) are actively buying XRP. Wallets holding between 1 million to 10 million XRP have increased their balance from approximately 3.54 billion tokens to 3.55 billion tokens after January 5.
Although the increase looks small, what matters most is its consistency. This group continues to add holdings even when prices fall, showing stable confidence.
Meanwhile, larger holders-those with between 10 million and 100 million XRP-exhibited a different behavior. They reduced exposure during the rally, likely to realize profits, but started buying again when the right shoulder started to form.
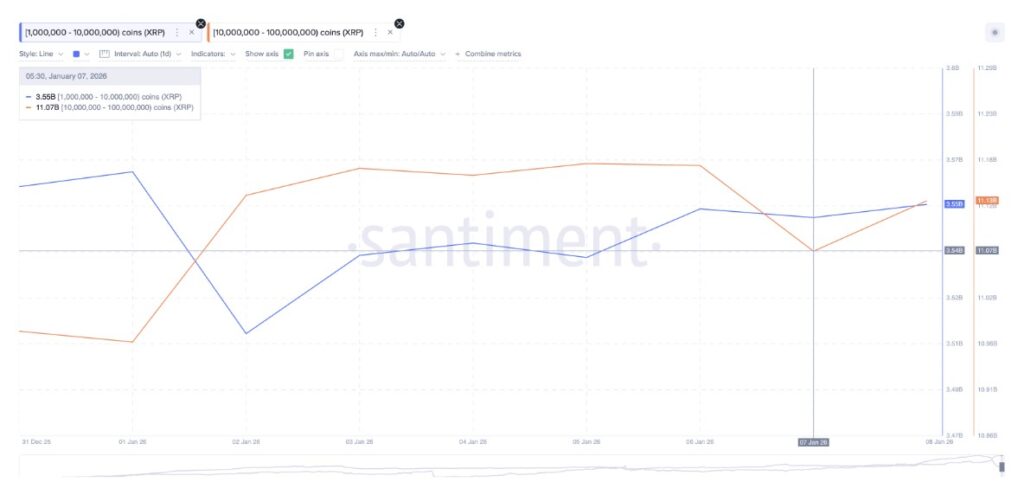
Their holdings increased from about 11.07 billion XRP to 11.13 billion XRP, or an addition of about 60 million tokens. At current prices, that equates to about $130 million in new accumulation.
The timing of these purchases is very important. These large holders no longer buy when prices are rallying. Instead, they buy when prices are in a consolidation phase. This pattern of behavior usually supports the formation of technical structures such as the inverse head-and-shoulders pattern.
Read also: Render Price Movement Shows Bullish Momentum? Here are the Charts to Watch!
XRP Price Risk Coming from Short-Term Buyers?
The main risk to XRP’s potential breakout comes not from the whale accumulation pattern, but rather from the sudden increase in short-term buyer participation.
HODL Waves data-whichcategorizes holders by length of time held-shows that very short-term holders (who only hold XRP for one day to one week) have increased their proportion of holdings significantly since December 30.
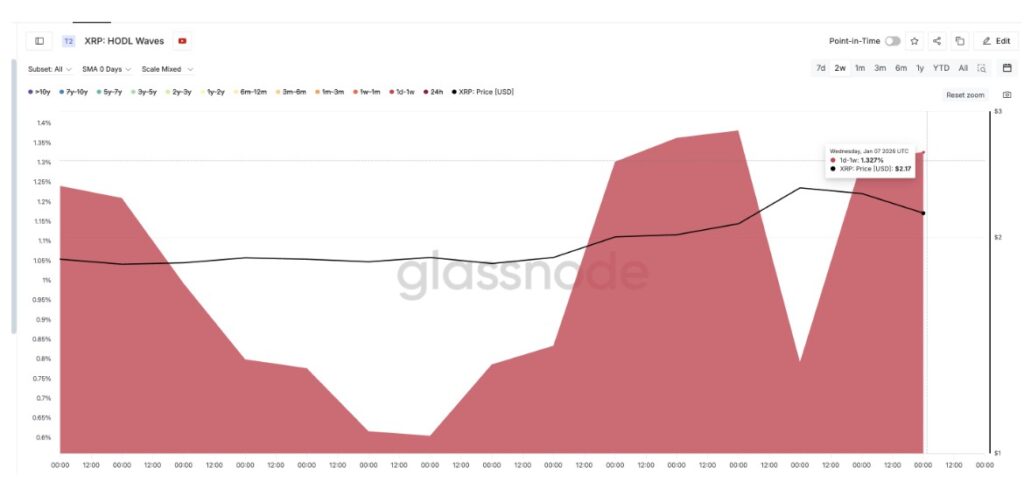
Their share rose from around 0.6% to around 1.33% of the total outstanding supply. This group tends to react quickly to price movements. They usually buy on breakouts and sell when prices correct, which can create pressure when prices are in a consolidation phase.
This kind of behavior can slow down the occurrence of clean breakouts. When market activity is dominated by short-term holders, prices often struggle to break through resistance levels without several attempts.
From a technical perspective, the important levels are quite clear. XRP needs a convincing daily close above $2.46 to challenge the resistance, and confirmation above $2.54 will validate the breakout. If that happens, the path to $3.19 and even $3.34-according to the projected 34% upside-would open up.
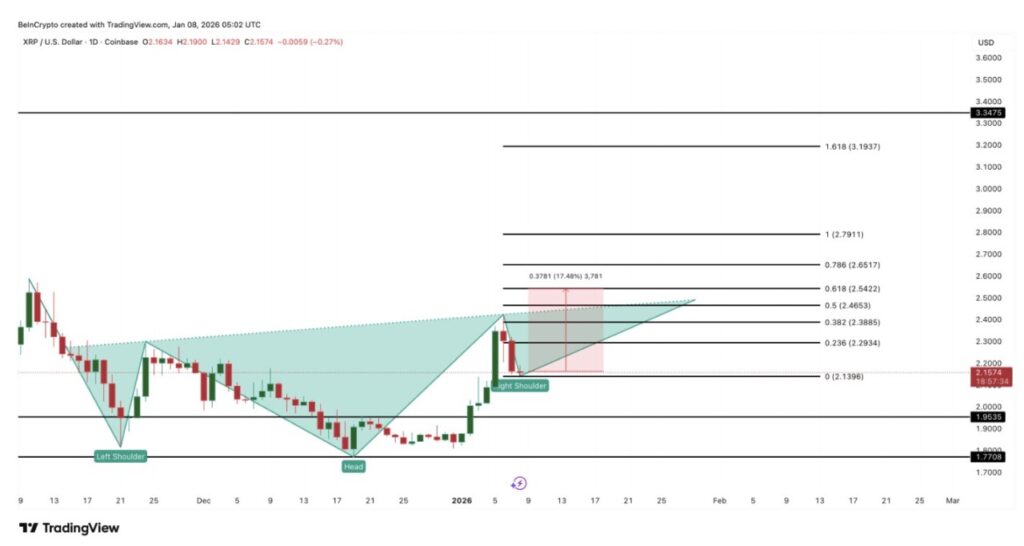
On the downside, a daily close below $2.13 would weaken the momentum and delay the move. Should that happen, the next areas of support are around $1.95 and $1.77, where the technical pattern is still considered valid despite starting to widen.
Overall, XRP’s price structure is quite strong, and real accumulation is underway.
However, the quality of buyers is as important as the quantity. If long-term buyers remain active and selling pressure from short-term holders subsides, then the potential for a breakout is still very much open to materialize.
That’s the latest information about crypto. Follow us on Google News to get the latest crypto news about crypto projects and blockchain technology. Also, learn crypto from scratch with complete discussion through Pintu Academy and stay up-to-date with the latest crypto market such as bitcoin price today, xrp coin price today, dogecoin and other crypto asset prices through Pintu Market.
Enjoy an easy and secure crypto trading experience by downloading Pintu crypto app via Google Play Store or App Store now. Also, get a web trading experience with various advanced trading tools such as pro charting, various types of order types, and portfolio tracker only at Pintu Pro.
*Disclaimer
This content aims to enrich readers’ information. Pintu collects this information from various relevant sources and is not influenced by outside parties. Note that an asset’s past performance does not determine its projected future performance. Crypto trading activities have high risk and volatility, always do your own research and use cold cash before investing. All activities of buying and selling bitcoin and other crypto asset investments are the responsibility of the reader.
Reference:
- BeInCrypto. XRP Price Up 34% With Breakout Risk. Accessed on January 9, 2026
Latest News
© 2026 PT Pintu Kemana Saja. All Rights Reserved.
The trading of crypto assets is carried out by PT Pintu Kemana Saja, a licensed and regulated Digital Financial Asset Trader supervised by the Financial Services Authority (OJK), and a member of PT Central Finansial X (CFX) and PT Kliring Komoditi Indonesia (KKI). Crypto asset trading is a high-risk activity. PT Pintu Kemana Saja do not provide any investment and/or crypto asset product recommendations. Users are responsible for thoroughly understanding all aspects related to crypto asset trading (including associated risks) and the use of the application. All decisions related to crypto asset and/or crypto asset futures contract trading are made independently by the user.