Ethereum Slips to $3,200 as Cup-and-Handle Pattern Takes Shape
Jakarta, Pintu News – Ethereum (ETH) is showing renewed strength. Its price rose by almost 7% on January 14, 2026 and has continued its recovery, with significant gains on the 12-hour chart.
This movement is not random. Ethereum has now broken out of the cup and handle pattern, a formation that is often taken as a signal of trend continuation if confirmed with favorable volume.
This breakout brings the $4,000 level back into focus. Although the structure looks positive, some momentum signals and on-chain data suggest that this potential rally remains risky. Then, how will Ethereum price move today?
Ethereum Price Drops 1.03% in 24 Hours
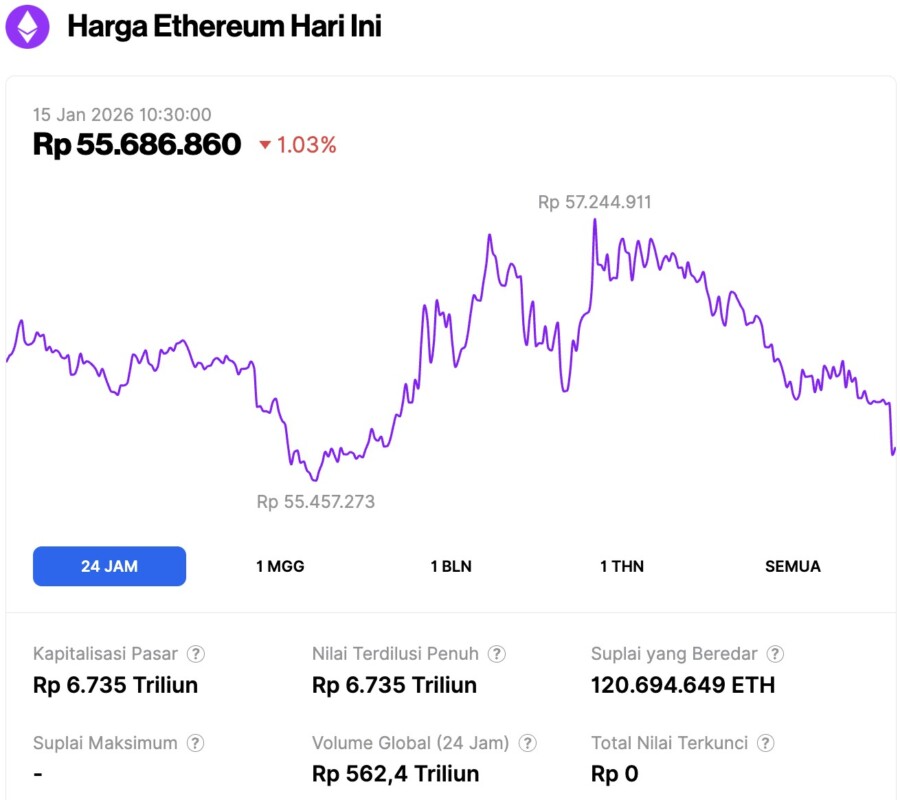
On January 15, 2026, Ethereum was trading at approximately $3,292, or around IDR 55,686,860, reflecting a 1.03% decline over the past 24 hours. Within the same period, ETH reached a low of IDR 55,457,273 and climbed as high as IDR 57,244,911.
At the time of writing, Ethereum’s market capitalization is estimated at IDR 6,735 trillion, while its daily trading volume has increased by 3% to IDR 562.4 trillion over the last 24 hours.
Read also: 3 Cryptos Whales Are Buying — and Selling — Ahead of the US CPI Report
Ethereum Confirms Cup-and-Handle Pattern, Backed by Strong Volume
On the 12-hour chart (1/14), Ethereum has completed a cup-and-handle pattern with a slightly declining neckline. The slope of this line is significant.
A declining neckline means that buyers have to absorb selling pressure at several levels, rather than just breaking through one flat resistance area in a single push. Simply put, price recovery requires more strength – this is why prices continue to rise gradually, rather than through sudden surges.
On January 13, Ethereum finally broke through that neckline and formed a strong bullish candle. Volume was the main confirmation.
This breakout occurred alongside an increase in green volume, indicating that buyers entered with conviction, not just because prices were rising due to thin liquidity. This active participation reduces the risk of a false breakout, although the continuation of the rise may be gradual rather than immediate.
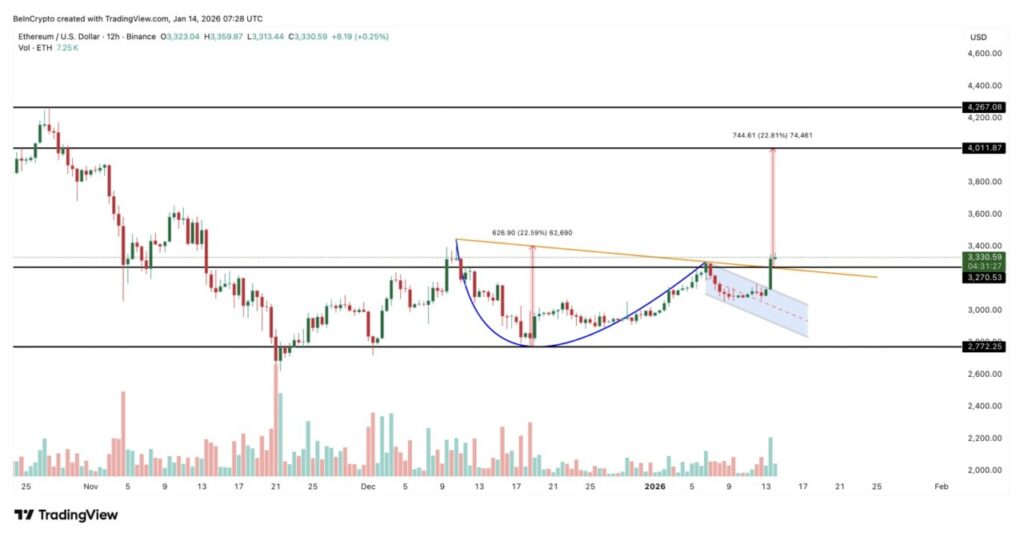
If measured from the bottom of the cup pattern, the technical target points to the $4,010 zone. This doesn’t mean Ethereum’s price should instantly reach that level in one fell swoop, but it does put the area back on the technical map after a few weeks of absence.
With the pattern structure and volume aligned, the bullish outlook is clear. The next question is whether the momentum can continue to support this move.
Momentum Risk Emerges as Short-Term Profits Rise
Although Ethereum’s price structure appears healthy, momentum indicators are starting to show potential risks. On the same 12-hour time frame, Ethereum’s Relative Strength Index (RSI) indicator is signaling a possible bearish divergence.
RSI measures momentum by comparing recent gains and losses. A bearish divergence forms when the price makes a higher high, while the RSI makes a lower high, which often indicates momentum is weakening. On the 12-hour chart, this could trigger a short-term correction.
Between January 6 and 14, the Ethereum price continued to rise, but the RSI has not yet confirmed this strength. This divergence is still in the process of forming, not yet confirmed.
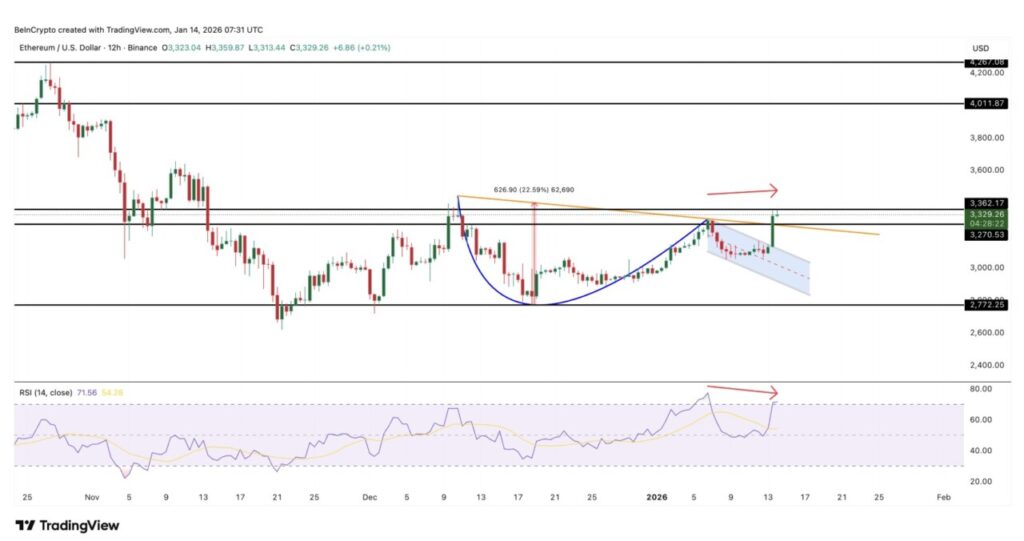
This divergence will likely be canceled if Ethereum is able to hold above the $3,360 area and the RSI goes back up. Until that happens, this signal remains a potential risk, not a definitive decision.
On-Chain Data Provides Additional Context
The NUPL (Net Unrealized Profit/Loss) indicator for short-term holders is currently at its highest level in the past two months, although it is still in the capitulation zone. NUPL measures whether asset holders are currently in a profit or loss position.
Read also: Bitcoin Climbs to $97,000 as Whales Accumulate — Is a Return to $100,000 on the Horizon?
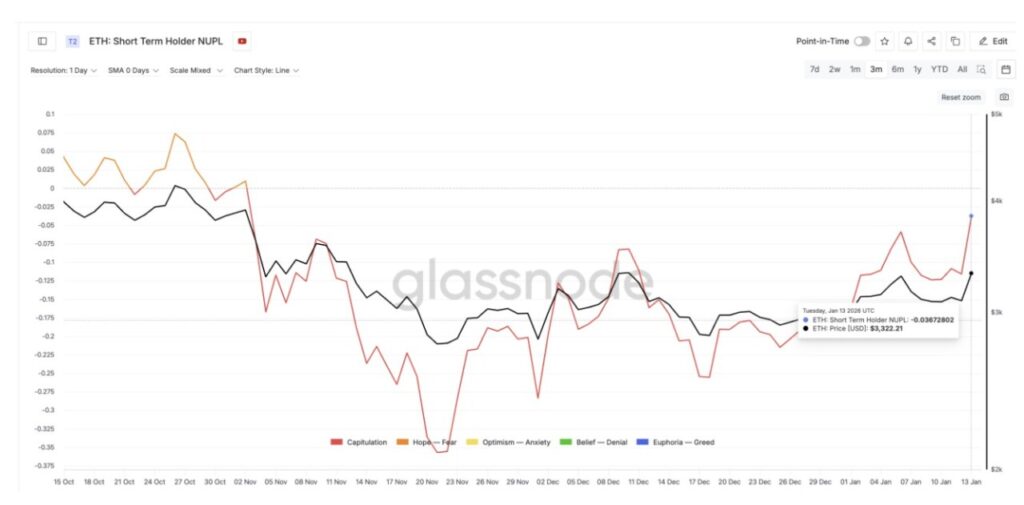
When NUPL rises, it means that more short-term holders have profits, which can increase the urge to sell.
This is important because the last time a short-term holder’s NUPL reached a local peak, Ethereum experienced a sharp decline. In early January, when NUPL peaked, Ethereum’s price dropped from around $3,295 to around $3,090 – a drop of around 6%. This historical reaction makes the current NUPL increase noteworthy.
However, there is an important difference this time around. Activity in spent coins-whichtracks whether newly purchased coins are being sold-is still relatively low. In the past 24 hours, the number of 30-60 day-old coins moved is down nearly 80% from its recent peak. This suggests that despite the increase in unrealized gains, short-term holders are in no hurry to sell their assets.
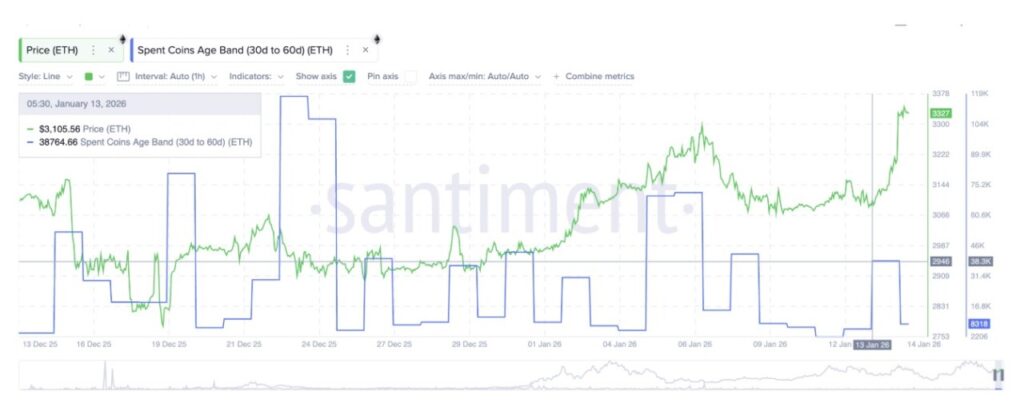
So while the NUPL indicator is rising, short-term holders are not yet showing signs of active distribution. This indicates that profits are there, but market confidence is still holding.
Ethereum Price Levels to Watch Right Now
With a still bullish price structure and the risk of momentum being conditional, Ethereum’s next move is highly dependent on key price levels.
Keeping positions above the $3,250-$3,270 area will maintain the validity of the breakout that has already occurred. If Ethereum is able to stabilize above the $3,360-$3,380 range, the risk of bearish divergence on the RSI will likely be overlooked for the time being, opening up room for momentum to return.
A clean and strong close above the zone will reinforce the potential for uptrend continuation towards $3,580, then $3,910, and finally the $4,000-$4,010 psychological area.
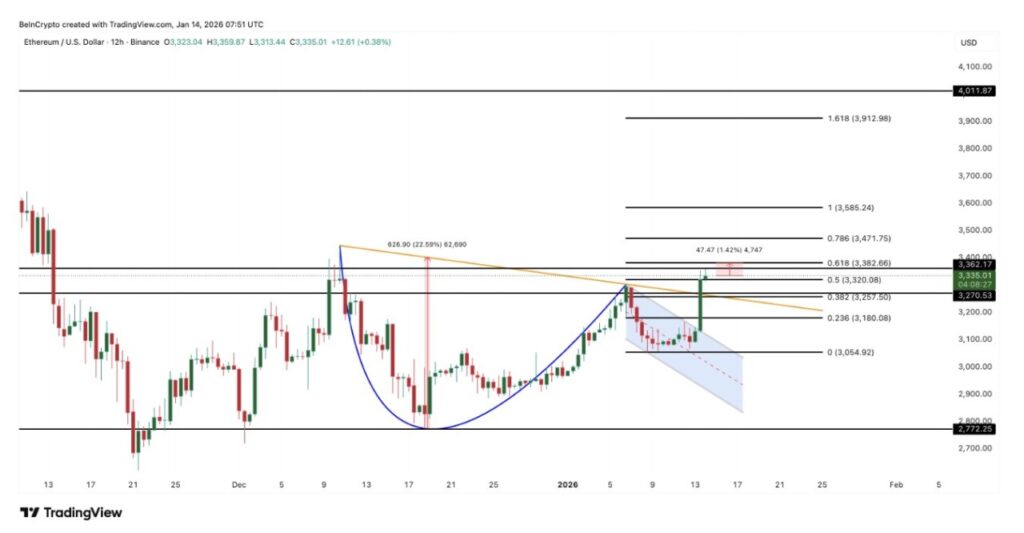
However, if momentum risk takes over-if the next candle closes below $3,360-then bearish levels start to come into focus. Losing support at $3,250 will weaken the short-term structure. Below that level, the $3,180 and $3,050 areas become the next important support zones, especially if short-term holders start realizing unliquidated profits.
Ethereum doesn’t need perfect conditions to keep rising. What it needs is volume to remain strong, the risk of momentum abating, and patience from short-term holders. If these three factors are maintained, the $4,000 target is no longer just a hope, but a technically realistic goal.
That’s the latest information about crypto. Follow us on Google News to get the latest crypto news about crypto projects and blockchain technology. Also, learn crypto from scratch with complete discussion through Pintu Academy and stay up-to-date with the latest crypto market such as bitcoin price today, xrp coin price today, dogecoin and other crypto asset prices through Pintu Market.
Enjoy an easy and secure crypto trading experience by downloading Pintu crypto app via Google Play Store or App Store now. Also, get a web trading experience with various advanced trading tools such as pro charting, various types of order types, and portfolio tracker only at Pintu Pro.
*Disclaimer
This content aims to enrich readers’ information. Pintu collects this information from various relevant sources and is not influenced by outside parties. Note that an asset’s past performance does not determine its projected future performance. Crypto trading activities have high risk and volatility, always do your own research and use cold cash before investing. All activities of buying and selling bitcoin and other crypto asset investments are the responsibility of the reader.
Reference:
- BeInCrypto. Ethereum’s Pattern Break Puts $4,000 Back on the Table – But Not Without Risks. Accessed on January 15, 2026
Latest News
© 2026 PT Pintu Kemana Saja. All Rights Reserved.
The trading of crypto assets is carried out by PT Pintu Kemana Saja, a licensed and regulated Digital Financial Asset Trader supervised by the Financial Services Authority (OJK), and a member of PT Central Finansial X (CFX) and PT Kliring Komoditi Indonesia (KKI). Crypto asset trading is a high-risk activity. PT Pintu Kemana Saja do not provide any investment and/or crypto asset product recommendations. Users are responsible for thoroughly understanding all aspects related to crypto asset trading (including associated risks) and the use of the application. All decisions related to crypto asset and/or crypto asset futures contract trading are made independently by the user.