3 Made in USA That Could Make Waves in February 2026
Jakarta, Pintu News – The crypto market often moves by position before the price reacts. In the last days of January, attention began to focus on a small group of coins created in the United States. These coins no longer followed the general market trend, but instead showed early signs of a major shift, either in the bullish or bearish direction.
Heading into February, these three American-made coins stood out for their price structure, on-chain positioning, momentum signals, and accumulation patterns, according to a BeInCrypto report.
Chainlink (LINK)
One of the US-made coins worth keeping an eye on this week is Chainlink (LINK). The price of LINK has been under pressure lately, dropping about 7.5% in the last seven days and about 3.6% in the last 30 days. At first glance, the trend still looks weak, but underlying signals are starting to show a change.
Read also: Solana Price Prediction: SOL Potentially Down amid Weak ETF and Retail Demand?
From an on-chain standpoint, Chainlink is currently trading at a relatively low 30-day MVRV level. MVRV compares the average coin holder’s purchase price to the current price.
When the MVRV becomes negative, it indicates that many traders are incurring losses. Historically, this usually reduces selling pressure and lowers the risk of further price declines. Simply put, LINK is no longer overrun by short-term profit takers.
The charts also support this view. Between late November and January 25, the Chainlink price printed lower lows, while the Relative Strength Index (RSI) formed higher lows.
The RSI measures momentum, and this divergence is known as a bullish divergence – it often appears when downward momentum begins to weaken, even though prices haven’t yet reversed.
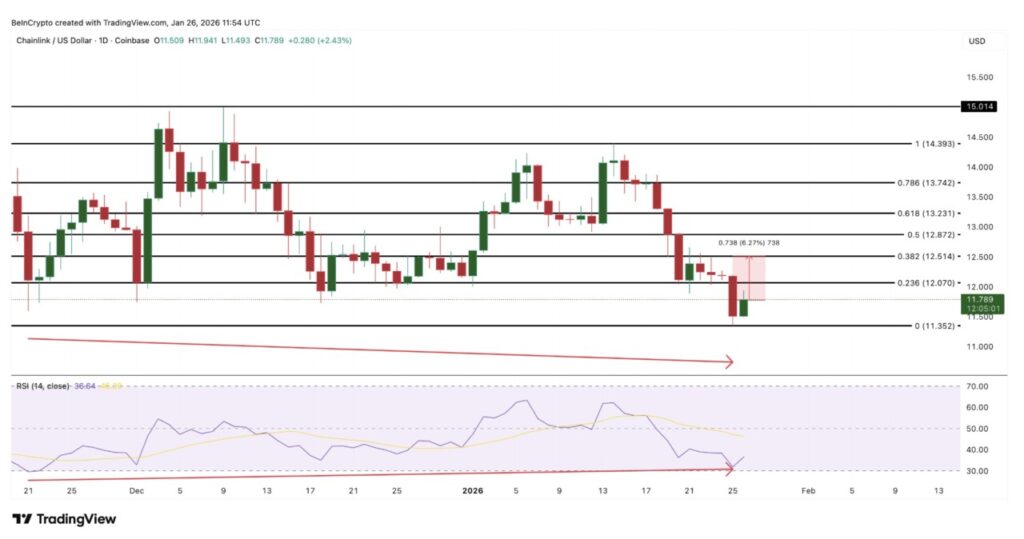
For this pattern to strengthen, Chainlink needs to break back through the $12.51 level, which has often been an area of support and resistance. A daily close above that level would be a signal that the recovery is gaining strength. If that happens, the next target would be $14.39, which could turn the overall price structure bullish, and pave the way towards $15.01.
However, if the price drops instead and closes daily below $11.35, the bullish scenario will be weakened, and the recovery will have to be postponed. Until then, LINK remains one of the technically interesting American-made coins heading into February.
World Liberty Financial (WLFI)
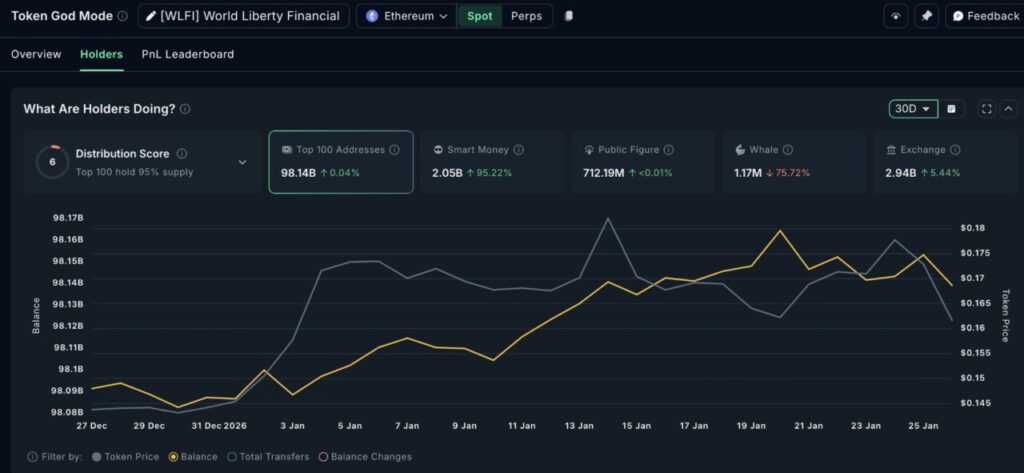
World Liberty Financial is another made in USA coin that caught the eye this week, but for a very different reason. Although the WLFI token is up about 12% in the last 30 days, the on-chain position shows a sharp divide between the whales and fast-moving capital.
Over the same period, whales reduced their WLFI holdings by more than 75%, while “smart money” wallets increased their exposure by around 95%.
“Smart money” usually represents short-term active traders, while whales reflect more long-term conviction. When these two groups move in diametrically opposite directions, it usually signals instability, not a clear trend.
The chart reflects the tension. WLFI forms a head-and-shoulders pattern on the daily time frame, but with a sharply downward sloping neckline-a signal that favors sellers. This structure indicates an increased downside risk if the support level fails to hold.
The token also recently lost the 20-day EMA (Exponential Moving Average) line, and is now at risk of testing the 50-day EMA. The last time both were broken at once, the price corrected by almost 20%.
The EMA gives more weight to recent price movements, making it more responsive to trend changes. These lines are often crucial support or resistance zones.
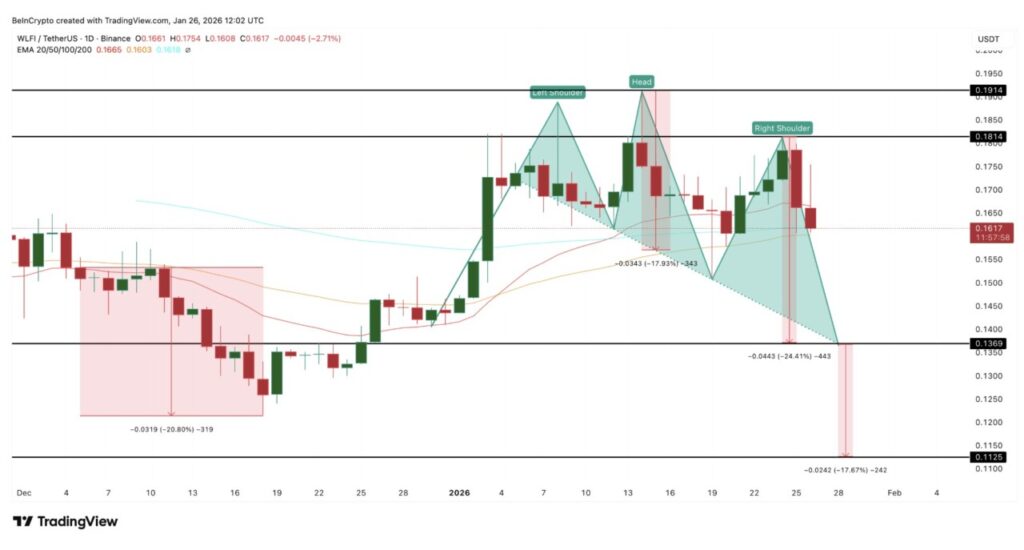
If WLFI drops below the 50 EMA and then breaks $0.136, the bearish pattern will get stronger, opening up the opportunity for a deeper correction towards $0.112.
Conversely, if it is able to reclaim the $0.181 level, it will restore some faith in the “smart money” narrative. A move above $0.191 would completely invalidate the bearish structure.
Read also: Amid Huge Whale Accumulation, Trump-Backed WLFI Switches from WBTC to ETH
This conflict made WLFI one of the most volatile coins to watch in the last week of January. There is still potential for a rebound, but market conviction is divided, and prices could move sharply in either direction.
Render (RENDER)
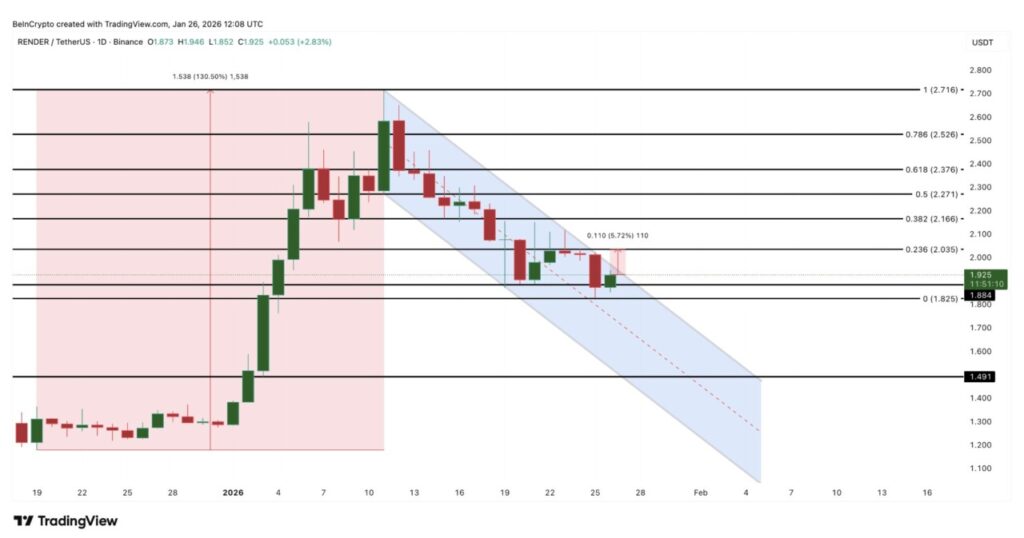
Render (RENDER) completes this list of made in USA cryptos with a setup that is more influenced by flows than sentiment. Despite having gained more than 50% in the last 30 days, the token experienced a correction of around 4% on January 26, 2026, leading some traders to start questioning whether this rally is starting to lose steam.
However, fund flow data on the bourse shows the opposite. At the end of December, Render noted large inflows to the exchange, signaling strong selling pressure.
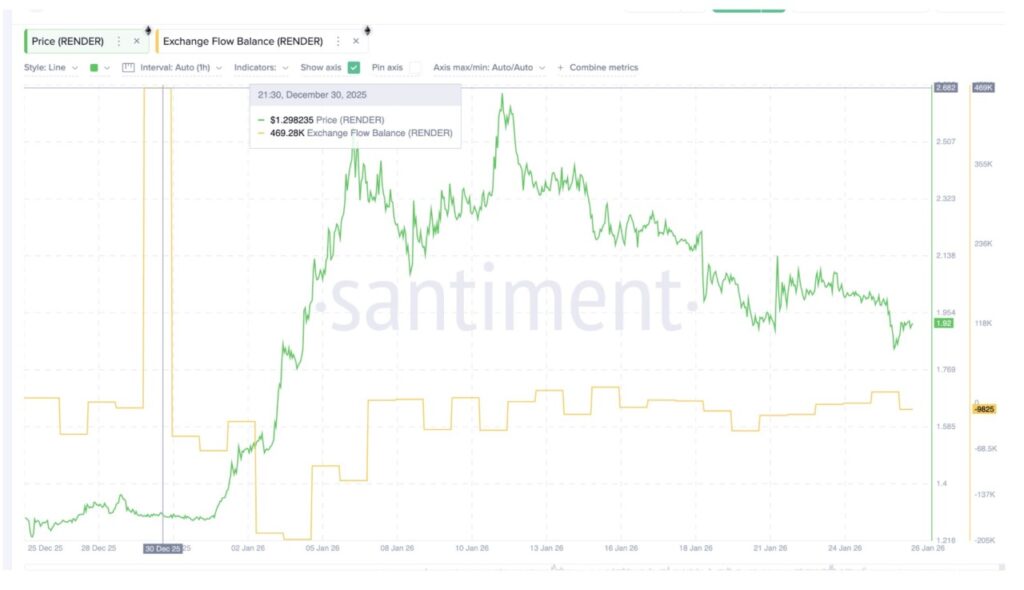
At its peak, the net inflow reached around 469,000 tokens. However, as of January 26, the figure has reversed to a net outflow of about 9,800 tokens. This shift suggests that the selling pressure has largely subsided, and accumulation may be starting to take place.
Technically, RENDER is consolidating in a falling channel pattern after a sharp 130% rally from December 19 to January 11. Although this pattern is still holding, the price is now starting to press the upper limit of the channel. If it manages to break above $2.03, the price structure will change from neutral to bullish.
If the breakout occurs, the next upside targets are around $2.37 and $2.71. However, if it fails to break the channel, the token remains vulnerable in the short term, with $1.88 as the first support level.
The chances of a deeper drop only increase if the price drops below $1.49-which is still quite far from the current price.
With the AI narrative still active and selling pressure starting to ease, Render emerged as one of the most structurally balanced American-made coins to observe in the last week of January.
Follow us on Google News to stay up to date with the latest in crypto and blockchain technology. Check Bitcoin price, usdt to idr and tokenized nvidia stock price through Pintu Market.
Enjoy an easy and secure crypto trading experience by downloading the Pintu crypto app via Play Store or App Store now. Also, experience web trading with advanced trading tools such as pro charting, various types of order types, and portfolio tracker only at Pintu Pro.
*Disclaimer
This content aims to enrich readers’ information. Pintu collects this information from various relevant sources and is not influenced by outside parties. Note that an asset’s past performance does not determine its projected future performance. Crypto trading activities are subject to high risk and volatility, always do your own research and use cold hard cash before investing. All activities of buying and selling Bitcoin and other crypto asset investments are the responsibility of the reader.
Reference:
- BeInCrypto. Made in USA Coins Last Week January 2026. Accessed on January 31, 2026
Latest News
© 2026 PT Pintu Kemana Saja. All Rights Reserved.
The trading of crypto assets is carried out by PT Pintu Kemana Saja, a licensed and regulated Digital Financial Asset Trader supervised by the Financial Services Authority (OJK), and a member of PT Central Finansial X (CFX) and PT Kliring Komoditi Indonesia (KKI). Crypto asset trading is a high-risk activity. PT Pintu Kemana Saja do not provide any investment and/or crypto asset product recommendations. Users are responsible for thoroughly understanding all aspects related to crypto asset trading (including associated risks) and the use of the application. All decisions related to crypto asset and/or crypto asset futures contract trading are made independently by the user.