3 Altcoins That Could Outshine Bitcoin, Ethereum, and XRP by February 2026
Jakarta, Pintu News – As the end of January 2026 approaches, market attention is beginning to shift away from major cryptocurrencies. Throughout most of this month, the prices of Bitcoin, Ethereum, and XRP have shown no significant movement. This stagnant state opens up opportunities for other assets that have clearer, shorter-term triggers to lead the market.
As a result, some altcoins have the potential to outperform the big cryptos. Based on analysis from the CCN website, Hyperliquid (HYPE), DASH, and Optimism (OP) are in the spotlight in this shift. This is not due to widespread risk sentiment, but rather because each has specific structural factors or token-related narratives that could drive prices up.
Hyperliquid (HYPE)
Hyperliquid is in the limelight as one of the altcoins that could potentially outperform Bitcoin (BTC), Ethereum (ETH), and XRP (XRP) by next month. In the past 30 days, the protocol has quietly established itself as the leading perpetual decentralized exchange. As proof, HYPE’s price has risen by 30%.
Read also: Solana Price Prediction: SOL Approaches Critical Support Amid Continued Bearish Pressure!
After falling in early January due to the release of supply related to team unlock, prices have stabilized and are showing signs of recovery. However, February added two important factors to this narrative.
HYPE is expected to benefit from planned listings on several major centralized exchanges, including Kraken and Coinbase. At the same time, the Hyperliquid team announced that 140,000 coins from Hyperliquid Labs will be unstaked and distributed to team members on February 6.
For some, this event could have a negative impact on the price of Hyperliquid coins. However, given the current situation, the demand for this altcoin seems strong enough to absorb the additional supply, especially with the 90% unlock reduction.
From the daily chart (Jan 29), HYPE started to show early signs of trend reversal after experiencing several months of downward pressure. At that time, the price was trading around $33.5 after bouncing off the $20 demand zone.
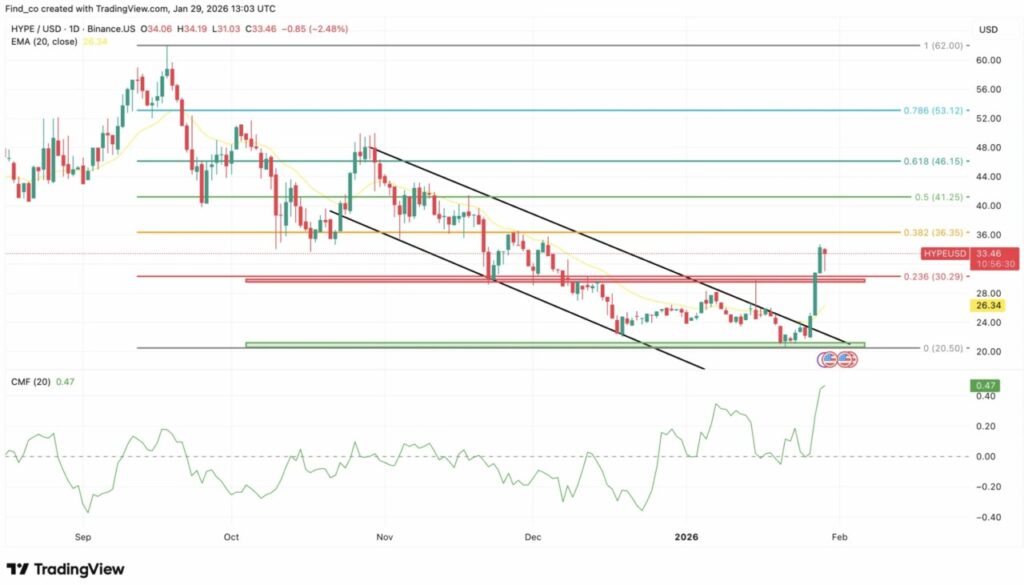
Most importantly, HYPE has managed to break out of the descending channel pattern. In addition, the Chaikin Money Flow (CMF) indicator surged to 0.47-the highest level in recent months.
This indicates aggressive buying pressure. At the same time, the price has managed to break and make the 20-day EMA line around $26.3 a short-term support level.
However, attention is now focused on resistance levels. HYPE is testing the 0.236 Fibonacci level around $30.29. If it is able to hold above this zone, then the bullish outlook will get stronger, opening up opportunities towards $36.35 (Fibonacci 0.382) and even $46.15 if momentum is maintained.
Even so, risks are still present. If the price is rejected back below $30, it could signal a false breakout and trigger a drop back to the lower range.
DASH
DASH comes from quite a different background. Often thought of as alegacy payment coin, DASH has experienced a sharp spike in development activity and is now leading the way among privacy coins in that regard.
This change was triggered by a roadmap update. The long-awaited Evolution platform upgrade-expected to be released in late February or March-is the most significant architectural change in DASH history.
This update will introduce decentralized data storage as well as functions at the application layer, taking DASH beyond just a means of payment to an asset with broader utility. As a result, sentiment towards DASH has turned positive. This has helped drive the price of DASH up by around 34% in the last 30 days.
From a technical perspective, DASH is currently forming a bullish pennant pattern, characterized by progressively lower peaks and progressively higher bottoms after a previous impulsive rally. This pattern is usually acontinuation structure, not a trend reversal. Selling pressure is starting to weaken, while buyers are defending higher price levels.
Read also: XRP Ready to Rebound? Whale buys XRP massively despite 21% price drop
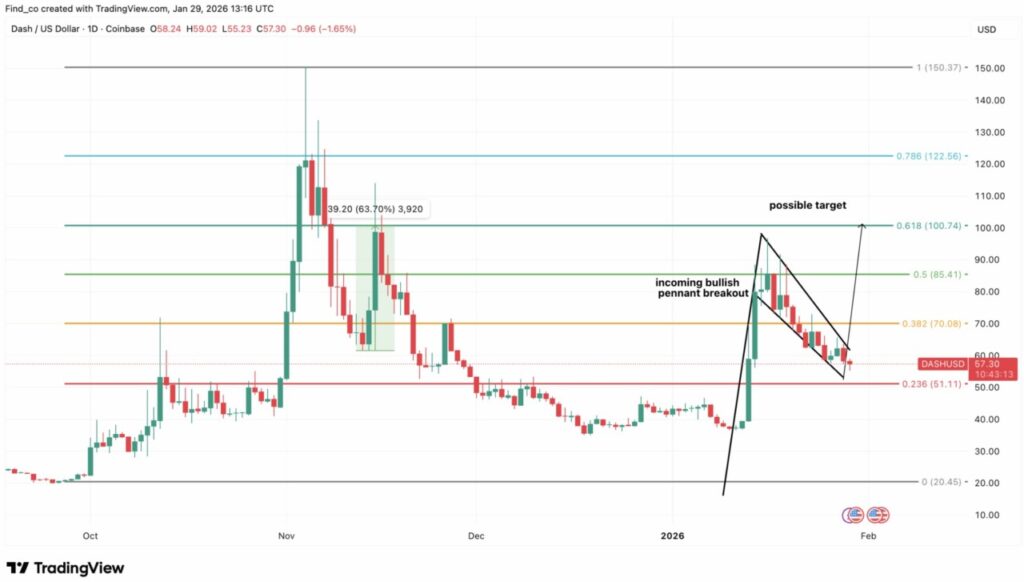
Crucially, the price of DASH remains above the 0.236 Fibonacci level at $51.11, which has become a reliable support area. As long as DASH stays above this zone, the bullish structure remains intact. In the event of an upward breakout, the upside target could be reached soon.
The first target is around $70 (Fibonacci 0.382). If the momentum continues, the $85 to $100 area-which aligns with the 0.5 and 0.618 Fibonacci retracement levels-is the next upside target. However, risks are still present. If the price closes daily below $51, the pennant pattern is considered a failure and could trigger a deeper correction to the $40 range.
Optimism (OP)
Optimism completes a trio of altcoins that have tokenomics-based catalysts, not just narratives. As one of the leading Layer-2 networks on Ethereum, OP has been known as an infrastructure asset. However, February could be an important turning point.
Recently, the Optimism Foundation proposed a revenue-sharing model that would direct 50% of revenue from sequencers across the Superchain ecosystem (including Base and Zora) to be used to buyback OP tokens. This proposal has now been approved. If this mechanism goes into effect, it will directly link network usage to token demand-something the market has been waiting for for a long time.
With OP’s current price hovering around $0.30, even a small breakout could change market perception, making OP an asset with yield potential rather than just a Layer-2 speculative token.
Currently, OP is under pressure again, dropping close to $0.28 after failing to sustain its previous gains. However, the price action suggests that the selling pressure is starting to weaken.
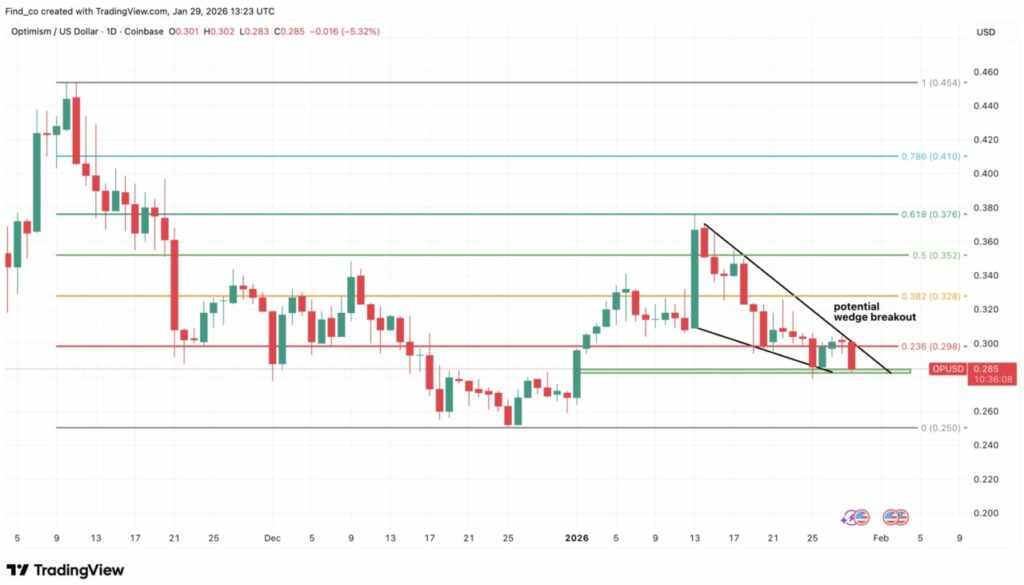
In the daily chart (Jan 29), OP prices formed a falling wedge pattern, which often signals a potential reversal. Sellers have been pressuring the price since mid-January, but each subsequent decline seems to be getting shallower. At the same time, buyers continue to defend the $0.28 demand zone, which also aligns with the 0.236 Fibonacci level.
This narrowing price range reflects market indecision. Volatility is starting to decrease, and momentum is slowly gathering. If OP manages to break the wedge resistance, the upside movement could quickly push the price towards $0.32, then $0.35, and finally to the $0.41 zone, where the Fibonacci levels of 0.618 and 0.786 converge.
If these levels are successfully recaptured, the medium-term outlook for OP will improve significantly. But conversely, if there is a net drop below $0.27, then this pattern will fail. This scenario could open up the opportunity for a further drop to $0.25, and make OP one of the altcoins that may struggle to survive.
Follow us on Google News to stay up to date with the latest in crypto and blockchain technology. Check Bitcoin price, usdt to idr and tokenized nvidia stock price through Pintu Market.
Enjoy an easy and secure crypto trading experience by downloading the Pintu crypto app via Play Store or App Store now. Also, experience web trading with advanced trading tools such as pro charting, various order types, and portfolio tracker only at Pintu Pro.
*Disclaimer
This content aims to enrich readers’ information. Pintu collects this information from various relevant sources and is not influenced by outside parties. Note that an asset’s past performance does not determine its projected future performance. Crypto trading activities are subject to high risk and volatility, always do your own research and use cold hard cash before investing. All activities of buying and selling Bitcoin and other crypto asset investments are the responsibility of the reader.
Reference:
- CCN. 3 Altcoins That Could Outperform Bitcoin, ETH, XRP in February 2026 – and Why. Accessed on January 30, 2026
Latest News
© 2026 PT Pintu Kemana Saja. All Rights Reserved.
The trading of crypto assets is carried out by PT Pintu Kemana Saja, a licensed and regulated Digital Financial Asset Trader supervised by the Financial Services Authority (OJK), and a member of PT Central Finansial X (CFX) and PT Kliring Komoditi Indonesia (KKI). Crypto asset trading is a high-risk activity. PT Pintu Kemana Saja do not provide any investment and/or crypto asset product recommendations. Users are responsible for thoroughly understanding all aspects related to crypto asset trading (including associated risks) and the use of the application. All decisions related to crypto asset and/or crypto asset futures contract trading are made independently by the user.