Silver Price Chart for the Last 30 Years: Trends & Value Changes
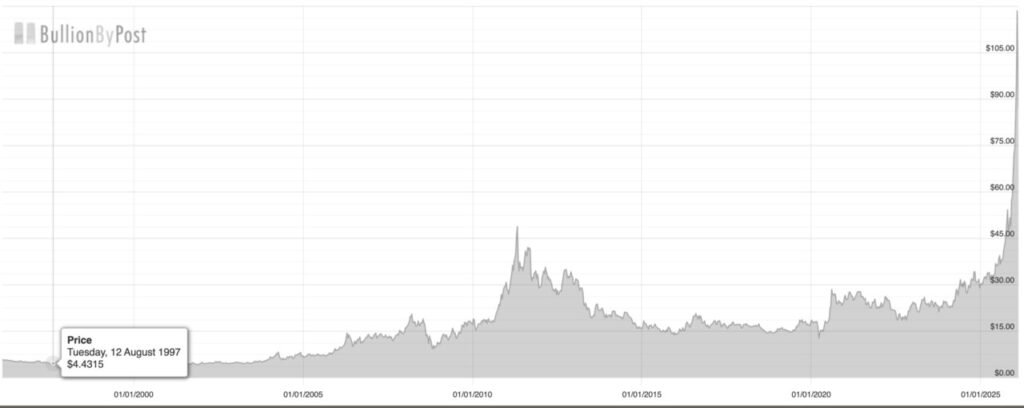
Jakarta, Pintu News – World silver prices have experienced significant fluctuations in the past three decades, reflecting responses to global economic conditions, industrial demand and market sentiment. At the beginning of the 30-year period, silver prices were relatively stable in the low range, but since the 2008 global financial crisis and increasing industrial and investment demand, prices have shown a strong long-term upward trend.
Historical data shows that the price of silver in US dollars (USD) per troy ounce has moved from levels below $10 more than three decades ago to a period of sharp increases in recent years.
During this period, silver prices hit decades of highs over historical resistance above $118 per ounce before undergoing a correction. These fluctuations were influenced by macro dynamics such as monetary policy, inflation, and changes in demand from the technology and renewable energy sectors. These price movements are important for investors monitoring safe-haven assets as well as industrial commodities, as silver plays a dual role as a precious metal and raw material for the electronics and solar energy industries.
Silver Price Trend Direction Over 30 Years
The long trend of silver prices shows a phase of stable low prices until the late 1990s and early 2000s. During this time, prices moved relatively narrowly between $4 and $6 per ounce before experiencing a major increase after the 2008 global economic crisis. The increase was partly triggered by changes in global monetary policy and investors’ shift to hard assets as a hedge against risk.
During the decade of the 2010s, silver prices exhibited high volatility with peaks during periods of commodity rallies followed by subsequent corrections. Price spikes were recorded when silver approached or crossed the $40-$50 per ounce level, reflecting strong bullish periods that later stabilized before entering a consolidation phase.
Also Read: 5 Shocking Facts About Jeffrey Epstein’s Influence in Silicon Valley
Factors Affecting Price Movement
Several important factors have influenced the silver price chart over the past 30 years, including industrial demand, monetary policy and investment sentiment. Silver has a dual function as a precious metal and an industrial material, so changes in industrial sector demand often have a direct impact on prices.
In addition, central bank interest rate policies, especially in the United States, affect silver’s appeal as a safe-haven asset. Declining interest rates and expectations of higher inflation often prompt investors to seek refuge in precious metals, including silver. These sweet periods are sometimes followed by periods of consolidation when economic conditions improve or the dollar ranges strengthen.
Silver Price in 30-Year Context
A look at the price chart of the last 30 years gives the perspective that silver has undergone several major price cycle phases. Initially, the metal was relatively undervalued compared to gold, but after a period of increased industrial and investment demand, silver showed significant upside potential. The historical peak above $118 per ounce marked the highest point in the period before the market adjusted.
Assessing charts in this context helps investors understand long-term support and resistance areas. Historical fluctuations allow for more informed technical analysis to determine potential entries and exits in commodity investment strategies or portfolio diversification with other assets such as cryptocurrencies.
Recent Moves & Future Trends
The most recent data available shows silver prices fluctuating around under $80 per ounce as early as 2026, remaining higher than in previous years. Price spikes in recent periods indicate the strength of physical demand and market pressure. Analysts expect that the long-term trend will still be driven by a combination of industrial demand, technological developments, and global economic expectations.
However, short-term movements remain vulnerable to global volatility influenced by factors such as interest rate policy, macro data, and geopolitical uncertainty. Assessing the price chart of the past 30 years is an important step to understanding the long-term dynamics as well as the risks involved in investing in commodities like silver.
Also Read: 5 Interesting Facts Behind the 2.5 BTC Transfer to Genesis Bitcoin Wallet
Follow us on Google News to stay up to date with the latest crypto and blockchain technology. Check Bitcoin price, USDT to IDR and Nvidia stock price tokenized via Pintu Market.
Enjoy an easy and secure crypto trading experience by downloading the Pintu crypto app via Play Store or App Store now. Also, experience web trading with advanced trading tools such as pro charting, various types of order types, and portfolio tracker only at Pintu Pro.
Gold-Based Crypto: When Physical Assets Meet Crypto Technology
As blockchain technology develops, gold can now be owned not only in physical form such as jewelry or bars, but also in digital form through gold-based crypto assets.
One of the most popular is Tether Gold (XAUt), a physical gold-backed ERC-20-based stablecoin, where 1 token represents 1 troy ounce of pure gold. The gold is stored in vaults in Switzerland and each token is directly linked to certified gold bullion. The system uses automated algorithms to efficiently manage the allocation of gold and Ethereum addresses.
XAUt tokens are available and traded on various crypto exchanges. XAUt is also an attractive alternative for those looking to hedge against inflation or global economic uncertainty, while remaining within the digital asset ecosystem.
*Disclaimer
This content aims to enrich readers’ information. Pintu collects this information from various relevant sources and is not influenced by outside parties. Note that an asset’s past performance does not determine its projected future performance. Crypto trading activities are subject to high risk and volatility, always do your own research and use cold hard cash before investing. All activities of buying and selling Bitcoin and other crypto asset investments are the responsibility of the reader.
Reference
- 30 Year Silver Price History in US Dollars Per Ounce. Accessed February 12, 2026.
Latest News
© 2026 PT Pintu Kemana Saja. All Rights Reserved.
The trading of crypto assets is carried out by PT Pintu Kemana Saja, a licensed and regulated Digital Financial Asset Trader supervised by the Financial Services Authority (OJK), and a member of PT Central Finansial X (CFX) and PT Kliring Komoditi Indonesia (KKI). Crypto asset trading is a high-risk activity. PT Pintu Kemana Saja do not provide any investment and/or crypto asset product recommendations. Users are responsible for thoroughly understanding all aspects related to crypto asset trading (including associated risks) and the use of the application. All decisions related to crypto asset and/or crypto asset futures contract trading are made independently by the user.