Bitcoin Price Surges to $68,000 Today: Momentary Recovery or Early Bull Run Signal?
Jakarta, Pintu News – Bitcoin (BTC) surged sharply this week, briefly approaching the $70,000 mark before finally correcting. The movement sparked debate across the market: has Bitcoin finallybottomed, or is this just a relief rally amid a broader bearish phase?
Various on-chain, derivatives, and institutional indicators are showing early signs of stabilization. However, key signals still point to a fragile recovery, rather than a confirmed bullish reversal.
Bitcoin Price Up 3.21% in 24 Hours
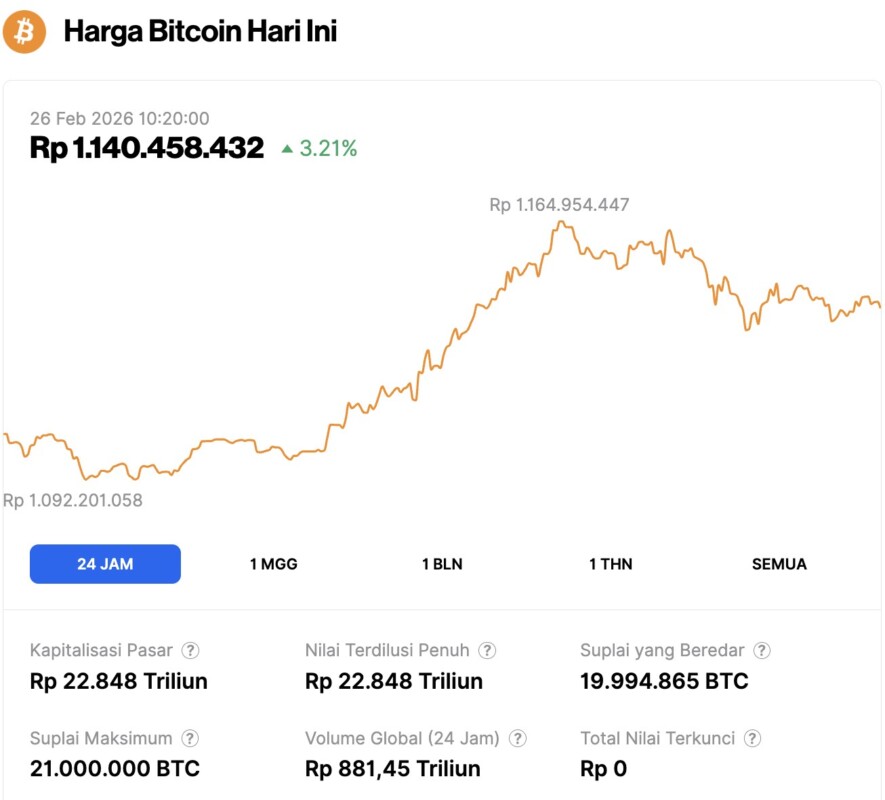
On February 26, 2026, Bitcoin showed resilient momentum, climbing to $68,095—equivalent to IDR 1,140,458,432. This represents a 3.21% gain over the last 24 hours. During this period, the leading cryptocurrency navigated a volatile range, bottoming out at IDR 1,092,201,058 before reaching an intraday peak of IDR 1,164,954,447.
As of this writing, Bitcoin’s total market capitalization hovers around IDR 22,838 trillion. Trading activity has also seen a significant uptick, with 24-hour volume surging by 22% to reach IDR 881.45 trillion, signaling heightened investor interest in the current price action.
Read also: Shiba Inu Price Prediction: ‘Death Cross’ Signal Appears, Will SHIB Plummet?
Options Market Shows Fragile Conditions, Not Strong Support
Bitcoin options positioning has recently shifted towards what traders call a negative gamma regime, according to Glassnode’s GEX heatmap.
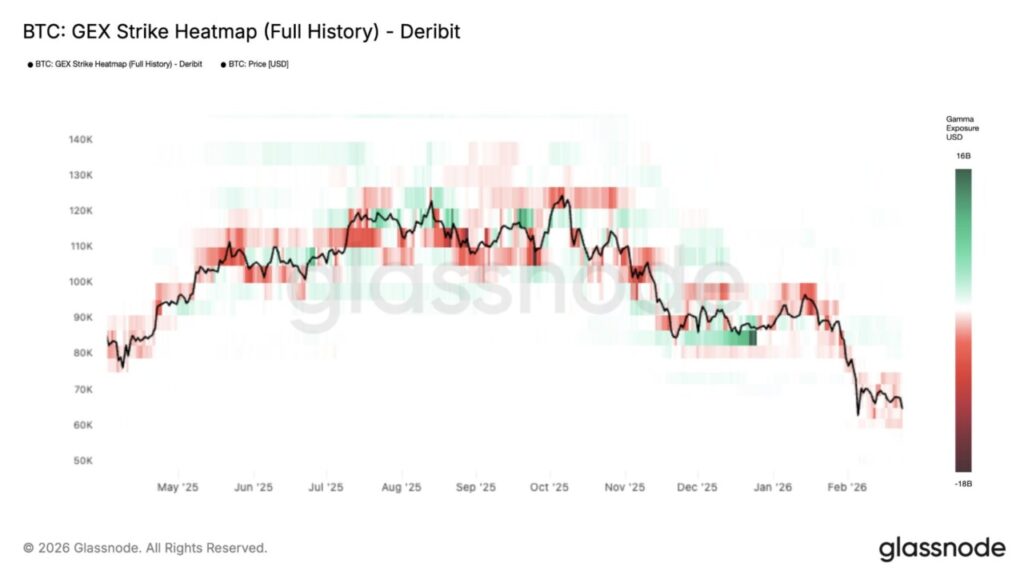
Simply put, gamma measures how optionsmarket makershedge against risk. When Bitcoin is in the negative gamma zone, dealers ‘ hedging tends to amplify price movements. This means that price rallies can accelerate quickly – but so canselloffs.
The heatmap also shows fewer “gammawalls” of strong resistance above the current price. This minimizes the barriers to upward movement, which explains the cause of Bitcoin’s sudden surge. However, it also means the market lacks structural stability.
Without strong hedging support, price movements remain fragile and vulnerable toreversals.
Spot Bitcoin Demand Improves for the First Time in Months
CryptoQuant data shows that Bitcoin’sapparent demand, which measures net accumulation versus new supply, has turned positive for the first time since November.
This is an important early signal. When demand exceeds supply, it indicates that buyers are stepping in and absorbing coins from sellers. However, a single positive shift does not yet confirm a complete reversal.
During bear market phases in the past, a temporary increase in demand often occurred before further consolidation. A sustained upward trend in demand over several weeks would provide stronger confirmation.
Short-Term Holders Still Selling at a Loss
Another key indicator comes from CryptoQuant’sshort-term holder profit and loss data, which monitors whether new investors are selling their assets at a profit or loss.
The data shows that short-term holders have been consistently selling at a loss since late January. Several large spikes in losses occurred in early February and were repeated recently.
Read also: SUI Volumes to Hit $43 Billion by Early 2026, Outpacing Other L1 Competitors
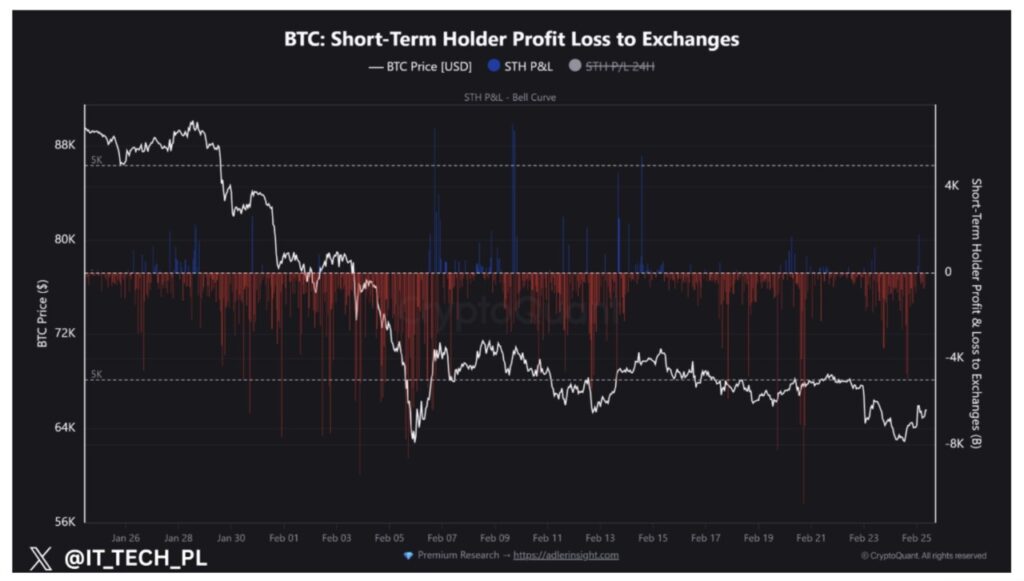
This pattern is known as capitulation, where “weaker” investors exit the market. Capitulation generally occurs nearmarket bottoms, as stronger buyers absorb the losses.
However, this signal has not been completely reversed. As long as short-term holders have not started selling with profits back, analysts warn that the price rally could become “exit liquidity“, where trapped investors sell off as prices rally instead ofholding.
Technical and Historical Data Show Selling Pressure Beginning to Ease
Bitcoin’s Relative Strength Index (RSI), a momentum indicator, has recently recovered after reaching extremeoversold levels in early February. This suggests that selling pressure has weakened.
Historically, this kind of RSI recovery often triggers a short-termrebound.
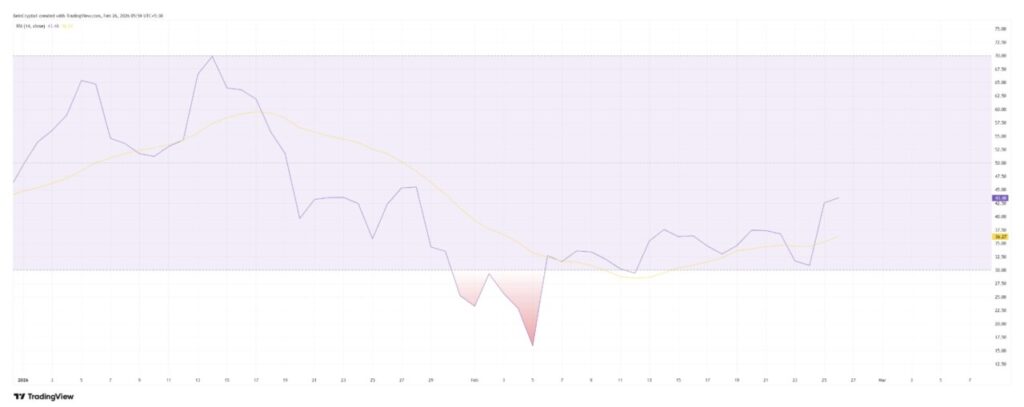
Quarterly performance data also shows that Bitcoin rarely experiences large losses for several consecutive quarters. While this pattern does not guarantee the price has bottomed out, it does support the view that the market may be entering a stabilization phase.
Institutional Fund Flows Still Showing Weakness
Institutional positioning remains a major concern. Previous data shows that Bitcoin ETFs are experiencing sustainedoutflows, and SEC reports reveal that large investment advisors andhedge funds are reducing their exposure significantly by the end of 2025.
This suggests that institutional demand has not fully returned. A strong bull market usually requires consistentinflows from large investors.
Early Signs of a Bottom, Yet Unconfirmed Bullish Market
Bitcoin is showing some early signs ofbottoming. Spot demand is starting to improve, capitulation seems to be getting absorbed by the market, and technical indicators show that selling pressure is starting to fade.
However, major confirmatory signals are still missing. Short-term holders remain in loss territory, institutional fund flows are still weak, and the options market structure shows fragile conditions.
For now, Bitcoin’s rally appears more consistent with arelief bounce than a confirmed bullish reversal. A sustained recovery will likely require stronger demand, a return of institutional inflows, and price stability above key resistance levels.
Follow us on Google News to stay up to date with the latest in crypto and blockchain technology. Check Bitcoin price, usdt to idr and tokenized nvidia stock price through Pintu Market.
Enjoy an easy and secure crypto trading and crypto gold investment experience by downloading the Pintu crypto app via Play Store or App Store now. Also, experience web trading with advanced trading tools such as pro charting, various order types, and portfolio tracker only at Pintu Pro.
*Disclaimer
This content aims to enrich readers’ information. Pintu collects this information from various relevant sources and is not influenced by outside parties. Note that an asset’s past performance does not determine its projected future performance. Crypto trading activities are subject to high risk and volatility, always do your own research and use cold hard cash before investing. All activities of buying and selling Bitcoin and other crypto asset investments are the responsibility of the reader.
Reference:
- BeInCrypto. Bitcoin Rebounds Toward $70,000, But Is It a Momentary Relief or Slow Bull Run Signal? Accessed on February 26, 2026
Latest News
© 2026 PT Pintu Kemana Saja. All Rights Reserved.
The trading of crypto assets is carried out by PT Pintu Kemana Saja, a licensed and regulated Digital Financial Asset Trader supervised by the Financial Services Authority (OJK), and a member of PT Central Finansial X (CFX) and PT Kliring Komoditi Indonesia (KKI). Crypto asset trading is a high-risk activity. PT Pintu Kemana Saja do not provide any investment and/or crypto asset product recommendations. Users are responsible for thoroughly understanding all aspects related to crypto asset trading (including associated risks) and the use of the application. All decisions related to crypto asset and/or crypto asset futures contract trading are made independently by the user.