3 Bitcoin Bearish Signals: MACD Touches 2022 Level, BTC Could Drop?
Jakarta, Pintu News – Bitcoin (BTC) price is back on the crypto market’s radar after important technical indicators showed signals reminiscent of the bear market conditions of 2022. In recent weeks, Bitcoin has failed to sustain price gains above the $74,000 level. This has raised concerns among cryptocurrency analysts that the market could enter a deeper downward phase.
1. Bitcoin MACD Indicator Drops to Bearish Levels Like 2022
A crypto market analyst and Chartered Market Technician, Tony Severino, revealed that the Moving Average Convergence Divergence (MACD) indicator on Bitcoin’s bi-weekly chart is showing increasing bearish momentum. MACD is a technical indicator used to measure the direction of the trend and the strength of the momentum of price movements.
Under current conditions, the MACD histogram shows an expansion of negative bars that are below the zero line. This indicates that the downward momentum is getting stronger and can be a signal that the selling pressure in the cryptocurrency market is increasing.
According to Severino, this pattern is even close to the conditions last seen in 2022 before the collapse of the Terra (LUNA) ecosystem, which triggered one of the biggest crypto winter in the history of the industry.
Also Read: Crazy Prediction! Bitcoin could reach Rp2.02 billion in March 2026, ETH to Rp202 million?
2. 2022 History: Bitcoin Has Plummeted 40%

When the Terra crisis occurred in May 2022, the crypto market experienced a major shock that led to a significant drop in Bitcoin price. During that period, Bitcoin dropped from over $50,000 to around $30,000 in just a few months.
If converted to rupiah at an exchange rate of IDR 16,987 per dollar, the price movement at that time was roughly equivalent to:
- $50,000 ≈ IDR 849.35 million
- $30,000 ≈ IDR 509.61 million
This drop meant that Bitcoin lost almost 40% of its value in a relatively short period of time. The event is one example of how a crisis in one part of the cryptocurrency ecosystem can trigger widespread impacts on global markets.
3. Bitcoin’s current price is already down 30% in 2026
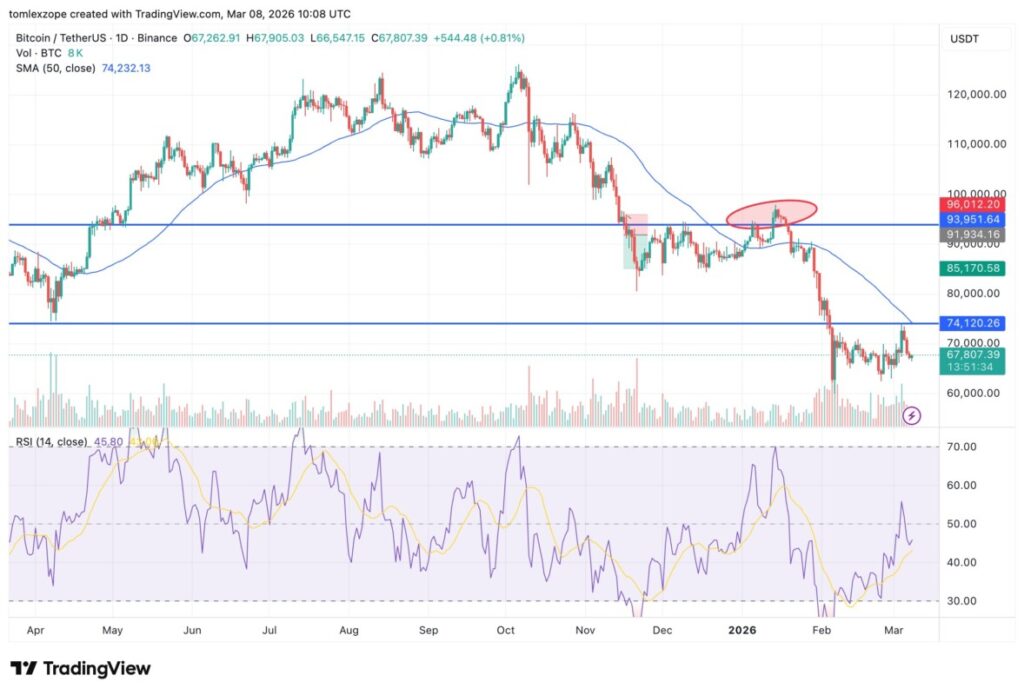
The latest data shows that the price of Bitcoin is around $67,520 or about Rp1.14 billion. In the past 24 hours, the price has not shown any significant changes, but the medium-term trend is still a concern for analysts.
Interestingly, Bitcoin has actually experienced a sizable correction so far this year. Overall, BTC has reportedly lost almost 30% of its value throughout 2026, which has led some market participants to start being cautious.
However, it should be noted that MACD is often referred to as a lagging indicator, which is an indicator that reflects conditions that have already occurred. This means that it is possible that most of the selling pressure is already reflected in the current price.
Conclusion
Technical signals appearing on the MACD indicator indicate that the Bitcoin market is in a fairly sensitive phase. The similarity of the pattern with the period before the Terra crash in 2022 led some analysts to warn of the possibility of additional bearish pressure on the crypto market.
However, technical indicators are not the only factors that determine the direction of cryptocurrency prices. Macroeconomic factors, the adoption of blockchain technology, and institutional investor activity also play an important role in determining Bitcoin’s future movements.
For investors and crypto newbies alike, understanding indicators like MACD can help to read market conditions more objectively. This approach can also be part of a risk management strategy in the face of high volatility in the cryptocurrency market.
Also Read: 5 Big Crypto Issues of March 2026: FOMC, Stablecoins, to Unlock Billion Worth Tokens
Follow us on Google News to stay up to date with the latest in crypto and blockchain technology. Check Bitcoin price, usdt to idr and tokenized nvidia stock price through Pintu Market.
Enjoy an easy and secure crypto trading and crypto gold investment experience by downloading the Pintu crypto app via Play Store or App Store now. Also, experience web trading with advanced trading tools such as pro charting, various order types, and portfolio tracker only at Pintu Pro.
*Disclaimer
This content aims to enrich readers’ information. Pintu collects this information from various relevant sources and is not influenced by outside parties. Note that an asset’s past performance does not determine its projected future performance. Trading crypto carries high risk and volatility, always do your own research and use cold hard cash beforeinvesting. All activities of buying and selling Bitcoin (BTC) and other crypto asset investments are the responsibility of the reader.
Reference
- Opeyemi Sule / Bitcoinist. Bitcoin MACD Drops To Bearish Level Not Seen Since 2022 – Crypto Winter Incoming? Accessed March 9, 2026.
Latest News
© 2026 PT Pintu Kemana Saja. All Rights Reserved.
The trading of crypto assets is carried out by PT Pintu Kemana Saja, a licensed and regulated Digital Financial Asset Trader supervised by the Financial Services Authority (OJK), and a member of PT Central Finansial X (CFX) and PT Kliring Komoditi Indonesia (KKI). Crypto asset trading is a high-risk activity. PT Pintu Kemana Saja do not provide any investment and/or crypto asset product recommendations. Users are responsible for thoroughly understanding all aspects related to crypto asset trading (including associated risks) and the use of the application. All decisions related to crypto asset and/or crypto asset futures contract trading are made independently by the user.