Etehreum and Solana Price Prediction in April 2026: These are the Key Levels to Watch!
Jakarta, Pintu News – ETH and SOL price movements are now at the center of geopolitical turmoil that is hard to ignore. The proposed 4 to 6-week deadline to resolve the Iran conflict, along with rising oil prices and troop deployments, brings new uncertainty to an already fragile market.
When macro tensions rise, risky assets like cryptocurrencies usually come under pressure, especially altcoins. Under these conditions, the market could potentially enter a more volatile phase in the near future.
ETH and SOL prices face macro pressures
Since these developments emerged, oil prices have risen again, inflation concerns have resurfaced, and market appetite for riskier assets is looking increasingly fragile. This is generally a negative sentiment for assets like Ethereum (Ethereum) and Solana (SOL), which typically perform better when market liquidity is flowing.
Read also: Crypto Fear and Greed Index is at Level 29, Why did the Crypto Market Crash Today?
However, it’s important to look at this more realistically. Crypto markets don’t always move in predictable patterns, and in turbulent situations, decentralized systems can sometimes show their resilience.
However, in the short term, pressure is pressure, and right now the burden is clearly increasing so the market is still clouded with uncertainty.
ETH price struggles to break through important resistance levels
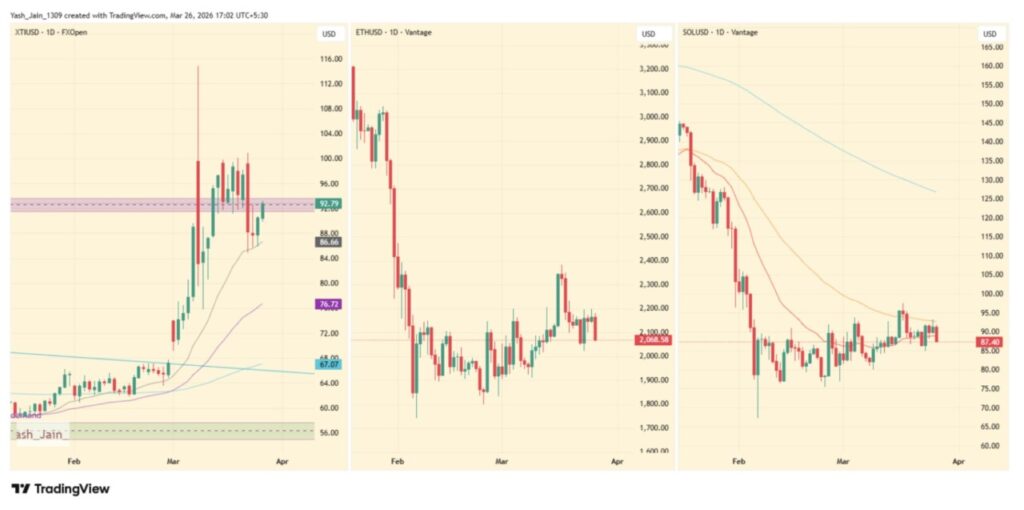
One thing that is quite clear from the current movement is that the ETH price is still stuck below the $2,400 resistance level. The area acts as an upper limit that suppresses the price, so ETH continues to move in a fairly difficult consolidation phase.
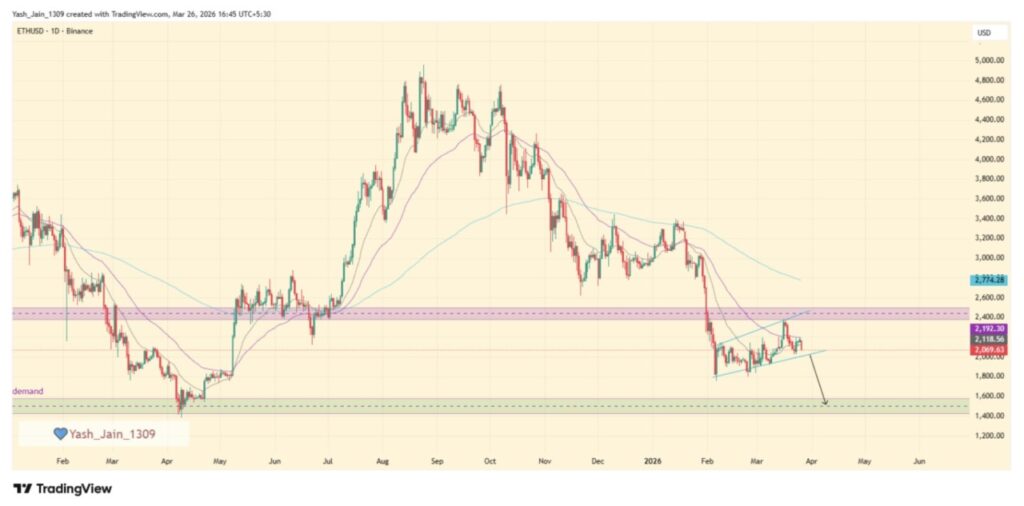
However, when viewed in a broader framework, the structure looks less convincing. The price movement pattern is pointing towards an ascending channel, and in conjunction with the sharp decline that occurred in January, this formation is starting to resemble a bearish continuation pattern. This is certainly not the signal that bullish market participants want to see.
As such, Ethereum price analysis is now highlighting the possible follow-up scenarios of the pattern. If the bearish pattern is completely confirmed, the downward pressure could take ETH to the area as low as $1,500. A number of technical indicators have not given much peace of mind.
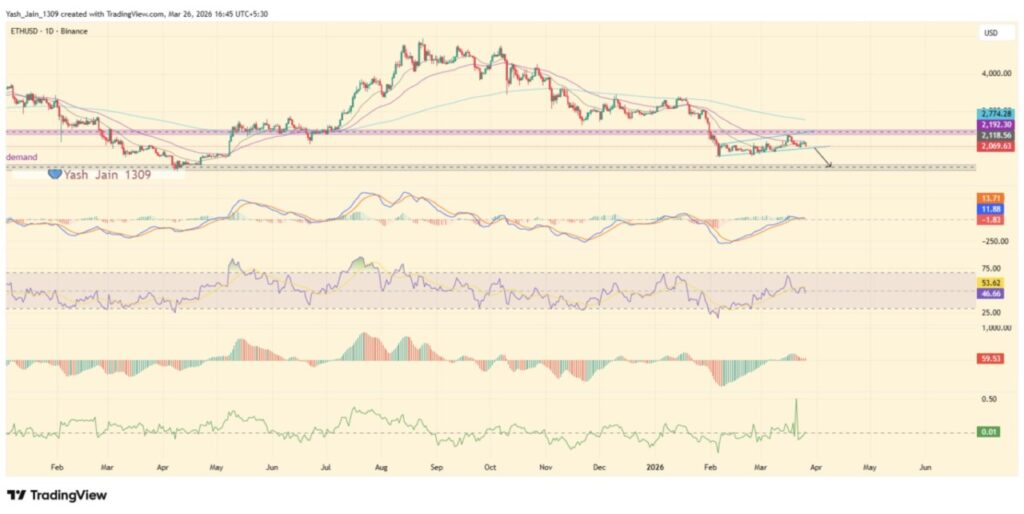
MACD just formed a bearish cross, RSI dropped below the 50 level, AO started to show bearish tendencies, while CMF has been moving down since the mid-March peak and is now near the neutral area with the risk of going into the negative zone.
This is not yet a sure signal of a sharp fall, but it is certainly not strong enough to build market optimism.
SOL price follows ETH with weaker signals
Moving on to SOL’s price analysis, its movement looks similar to ETH, only with weaker signals.
Read also: TAO Crypto Price: Bittensor Soars 140%, Retail Sentiment Hints the Trend Isn’t Over?
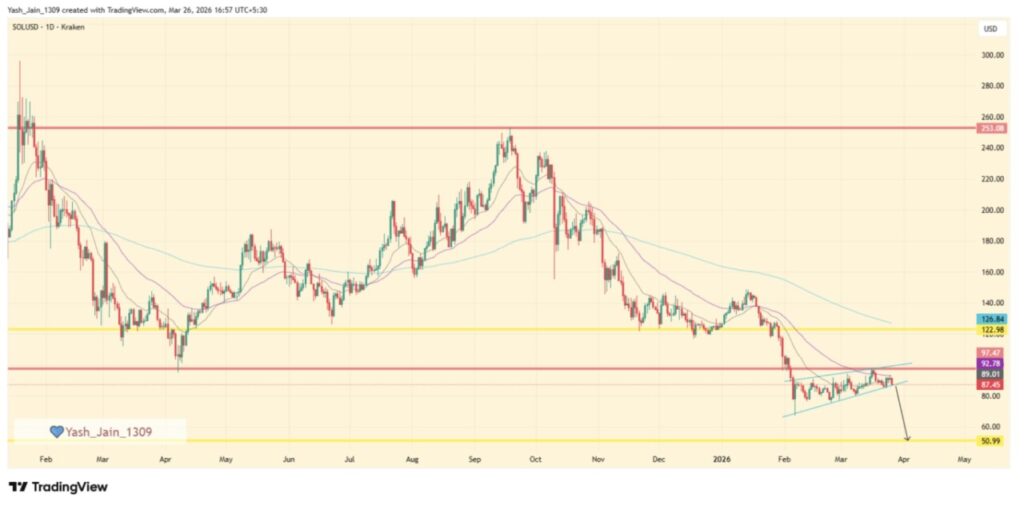
SOL price action shows a similar channel structure, with the $97 area being a key resistance level. If this level continues to fail to be broken, a consolidation phase could potentially take place throughout the 4 to 6 week period.
However, if that structure eventually breaks down, a downside target around $50 starts to become a viable scenario. A number of indicators are reinforcing this cautious stance. The RSI has dropped below the 50 level, the AO is showing increasing bearish momentum, and the CMF is at -0.02 indicating capital outflows.
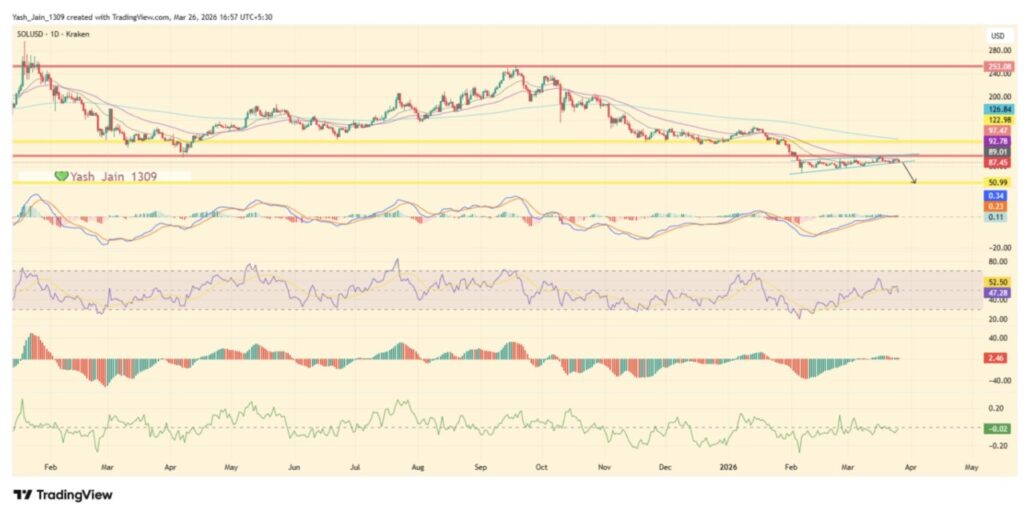
The only difference is that MACD hasn’t confirmed a bearish cross yet, but the conditions don’t reflect solid strength either.
ETH and SOL Price Outlook Still Vulnerable
So, what can be anticipated next? Generally speaking, the next 4 to 6 weeks are not just another timeframe, but a stressful phase. Amid geopolitical tensions, rising oil prices, and a weakening technical structure, the price trends of ETH and SOL are entering a crucial stage.
If stability is restored, it is possible that the consolidation phase may persist. However, if macro pressures intensify, then the downward scenario on the ETH and SOL price charts could soon turn from a possibility to a reality.
Follow us on Google News to stay up to date with the latest in crypto and blockchain technology. Check Bitcoin price, usdt to idr and tokenized nvidia stock price through Pintu Market.
As a safe crypto app, Pintu provides a crypto trading experience to access crypto gold investment easily and conveniently. You can also see today’ s gold jewelry price and today’s gold bullion price to support your investment activities and portfolio diversification as well as learn crypto through Pintu Academy.
Download the Pintu crypto app via Play Store or App Store now. Enjoy web trading experience with advanced trading tools such as pro charting, various types of order types, and portfolio tracker only at Pintu Pro.
*Disclaimer
This content aims to enrich readers’ information. Pintu collects this information from various relevant sources and is not influenced by outside parties. Note that an asset’s past performance does not determine its projected future performance. Crypto trading activities are subject to high risk and volatility, always do your own research and use cold hard cash before investing. All activities of buying and selling Bitcoin and other crypto asset investments are the responsibility of the reader.
Reference:
- Coinpedia. ETH and SOL Price Prediction: Key Levels to Watch in the Next 4-6 Weeks. Accessed on March 27, 2026
Latest News
© 2026 PT Pintu Kemana Saja. All Rights Reserved.
The trading of crypto assets is carried out by PT Pintu Kemana Saja, a licensed and regulated Digital Financial Asset Trader supervised by the Financial Services Authority (OJK), and a member of PT Central Finansial X (CFX) and PT Kliring Komoditi Indonesia (KKI). Crypto asset trading is a high-risk activity. PT Pintu Kemana Saja do not provide any investment and/or crypto asset product recommendations. Users are responsible for thoroughly understanding all aspects related to crypto asset trading (including associated risks) and the use of the application. All decisions related to crypto asset and/or crypto asset futures contract trading are made independently by the user.
