Ethereum Holds Near $2,100 as Bullish Signals Build for a Possible Move Higher
Jakarta, Pintu News – Ethereum (ETH) is currently showing two bullish signals simultaneously, with momentum on the weekly chart starting to strengthen and short-term price action reclaiming important levels. The combination of these two setups suggests that ETH still has a chance to continue rising, although market participants will still have to face areas of strong resistance before the direction of the larger trend becomes clear.
Then, how is Ethereum’s current price movement?
Ethereum Price Drops 0.78% in 24 Hours
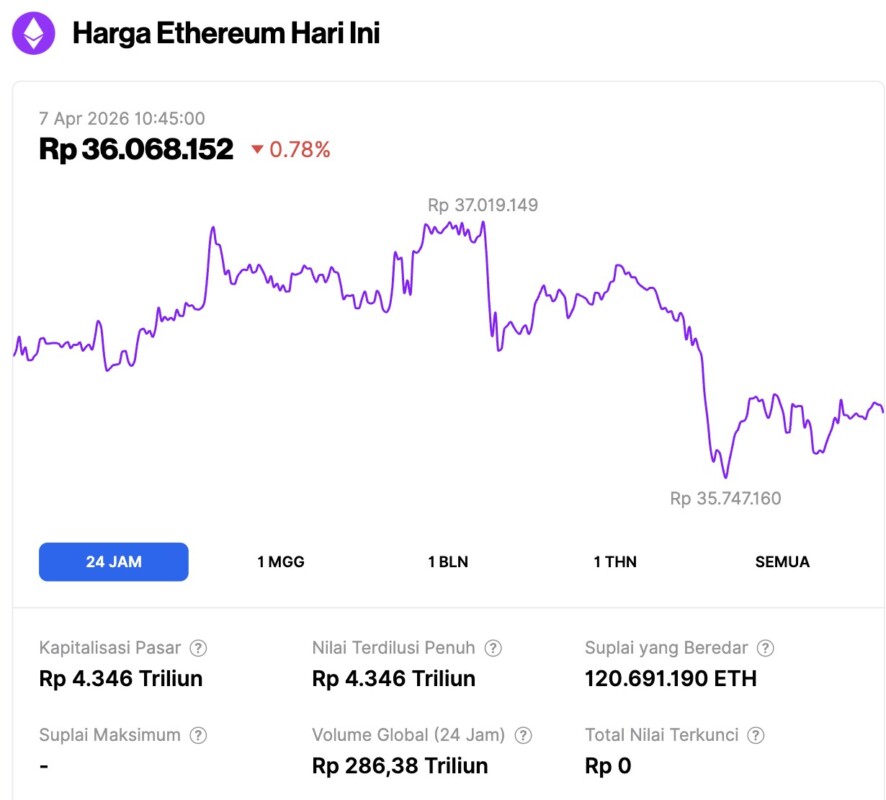
As of April 7, 2026, Ethereum was trading at around $2,106, or approximately IDR 36,068,152, marking a modest 0.78% decline over the past 24 hours. During that same period, ETH moved within a daily range, falling to a low of IDR 35,747,160 and climbing to a high of IDR 37,019,149.
At the time of writing, Ethereum’s market capitalization stood at roughly IDR 4,346 trillion, while its 24-hour trading volume jumped 41% to IDR 286.38 trillion.
Read also: Bitcoin Falls to $68,000 Today: After Three Bullish Signals, Why Is BTC Still Stuck?
Ethereum’s MACD Turns Up on Weekly Chart, Previous Pattern Points to Recovery Signal
Ethereum is starting to show an early momentum shift on the weekly chart, as the MACD indicator begins to curve upwards from deep negative territory. The chart shared by Jake Wujastyk shows a pattern that has also appeared before, with the latest boxed area showing ETH beginning to stabilize as the MACD line slowly turns upwards.
This is important because similar patterns in previous periods were followed by stronger upward movements. In the lower indicator, the blue MACD line is starting to move up near the orange signal line after a long decline. At the same time, the price is moving sideways within a narrow weekly range, indicating that the selling pressure may be easing.
The chart shows more of a transitional phase than a confirmed breakout. In other words, Ethereum has not yet completed a full bullish reversal, but its momentum structure is starting to improve. Some of the earlier boxed areas on the chart suggest that a similar MACD reversal formed near the local bottom before the price moved higher in the following weeks.
The price movement also supports the reading. Ethereum briefly dropped sharply before finally entering into a narrower consolidation zone near its latest low. Bottom formation like this is important because it shows that the market is no longer going down in a straight line, while the momentum below it is recovering.
However, this signal is not strong enough on its own. A rising curve on the weekly MACD may indicate strength beginning to build, but market participants generally wait for a continuation of price action before taking it as confirmation.
As long as Ethereum hasn’t broken out of its current range, the setup is still classified as an early bullish signal, not definitive proof of a larger trend change.
For now, the main conclusion is quite clear. Ethereum’s weekly MACD is starting to point upwards again, and several previous instances on the chart show that this structure once preceded an upward price movement. Therefore, market participants are now watching to see if this recovery signal will develop further in the next few weekly candles.
Ethereum Reclaims Important Support, Chart Opens Opportunity to Rise to $2,200
Ethereum moved back above the $2,100 area after being able to hold in the $2,000 range, based on the daily chart shared by Ted. The setup shows ETH bounced off the lower support cluster and managed to reclaim an important short-term level that was previously a bottleneck in the structure of the last move.
Read also: Altcoin Season Index Touches Level 32 Today, Can Altcoin Beat Bitcoin in 2026?
This bounce is important as the chart depicts a possible move towards the next resistance zone in the upper area. The first red band is near the current breakout area, while higher resistance is marked in the mid $2,400 range and another level around $2,624. In the short term, this chart shows that Ethereum could potentially test the $2,200 area first if buyers continue to dominate the market.
However, this structure is not yet fully bullish. The white arrows on the chart show two possible scenarios, with one of them pointing to a short-term continuation of the upswing before rejection. This means that a breakout above $2,100 does temporarily improve momentum, but it doesn’t rule out another decline afterward.
The key point is that the $2,000 area managed to hold when Ethereum desperately needed a foothold of support. Because of this, buyers again have room to push for a relief rally. However, the chart also still shows strong resistance above, so any upside could potentially face selling pressure as ETH approaches the next supply zone.
For now, Ethereum’s short-term picture looks better after recovering above $2,100. If this breakout can be sustained, ETH still has a chance to continue rising towards $2,200 before the market determines whether the trend will continue upwards or return to a broader downward phase.
Follow us on Google News to stay up to date with the latest in crypto and blockchain technology. Check Bitcoin price, usdt to idr and tokenized nvidia stock price through Pintu Market.
As a safe crypto app, Pintu provides a crypto trading experience to access crypto gold investment easily and conveniently. You can also see today’ s gold jewelry price and today’s gold bullion price to support your investment activities and portfolio diversification as well as learn crypto through Pintu Academy.
Download the Pintu crypto app via Play Store or App Store now. Enjoy web trading experience with advanced trading tools such as pro charting, various types of order types, and portfolio tracker only at Pintu Pro.
*Disclaimer
This content aims to enrich readers’ information. Pintu collects this information from various relevant sources and is not influenced by outside parties. Note that an asset’s past performance does not determine its projected future performance. Crypto trading activities are subject to high risk and volatility, always do your own research and use cold hard cash before investing. All activities of buying and selling Bitcoin and other crypto asset investments are the responsibility of the reader.
Reference:
- Coinpaper. Ethereum Price Prediction: MACD Turns Up, $2.1K Holds. Accessed on April 7, 2026
Latest News
© 2026 PT Pintu Kemana Saja. All Rights Reserved.
The trading of crypto assets is carried out by PT Pintu Kemana Saja, a licensed and regulated Digital Financial Asset Trader supervised by the Financial Services Authority (OJK), and a member of PT Central Finansial X (CFX) and PT Kliring Komoditi Indonesia (KKI). Crypto asset trading is a high-risk activity. PT Pintu Kemana Saja do not provide any investment and/or crypto asset product recommendations. Users are responsible for thoroughly understanding all aspects related to crypto asset trading (including associated risks) and the use of the application. All decisions related to crypto asset and/or crypto asset futures contract trading are made independently by the user.