Market Analysis Jan 15th, 2024: Moderate Market Reaction Follows Historic Bitcoin ETF Launch

The long-awaited spot Bitcoin exchange-traded fund (ETF) finally received approval from the United States Securities and Exchange Commission (SEC) on January 10. However, expectations that the price of BTC would jump sharply after ETF approval have not materialized. So, will ETFs truly have a significant impact on the crypto market? Let’s delve into the analysis below.
As usual, the Pintu trading team has gathered critical information and analyzed the general economic situation and the crypto market’s movements over the past week. However, it should be noted that all information in this Market Analysis is intended for educational purposes, not as financial advice.
Market Analysis Summary
- 🟢 Bitcoin ETFs surged in their debut, hitting $4.6 billion volume and boosting BTC by 5%. But the cryptocurrency market cap sank $20 billion, settling at $1.76 trillion.
- 📈 The unemployment rate in the United States (US) stabilized at 3.7% indicating a positive employment trend.
- 💼 The US trade deficit shrank in November 2023 by 2.0% or to $63.2 billion. Imports of consumer goods declined and exports weakened as global demand fell due to central bank rate hikes.
- 📉 US inflation in December jumped by a monthly 0.3% (expectation 0.2%) and an annualized increase of 3.4% (expectation 3.2%).
Macroeconomic Analysis
Unemployment Rate

December 2023 continued the positive employment trend, adding 216,000 jobs and holding the unemployment rate steady at 3.7%. However, this pace was slightly slower than the year’s monthly average of 225,000. On a brighter note, wage growth ticked up to 4.1% year-on-year (YoY), though it remained below the 4.7% seen in December 2022. Overall, the December jobs report indicated a stable and strengthening job market, tempered by slightly slower job growth and persistent challenges with wages keeping pace with inflation.
Other Economic Indicators
- ISM Services Purchasing Managers’ Index (PMI): According to the Institute for Supply Management (ISM) survey, the non-manufacturing PMI dropped to 50.6 in December, marking the lowest reading since May. This signified a contraction in the services industry, which represents over two-thirds of the economy. Notably, the reading fell short of economists’ expectations of a marginal change at 52.6.
- Trade Balance: The US trade deficit narrowed by 2.0% to $63.2 billion in November. This decrease was primarily driven by a decline in imports of consumer goods, reaching their lowest level in a year due to weakened domestic demand. Exports also fell, reflecting decreased global demand caused by rising central bank interest rates. If this trend persists, the trade balance may have minimal impact on economic growth. Notably, the October deficit was revised upward slightly from $64.3 billion to $64.5 billion.
- Unemployment Claims: U.S. jobless claims edged down to a 3-month low of 202,000, falling 1,000 from the previous week. This decline signifies a resilient U.S. labor market despite rising interest rates, further underscored by the 4-week average decline of 207,750 (down 250). Notably, the U.S. unemployment rate has remained below 4% for 22 consecutive months, the longest streak since the 1960s. These figures, paired with the economic resilience amid inflation concerns, fuel optimism for a “soft landing” scenario with slowing inflation and falling jobless claims.
- Consumer Price Index (CPI): U.S. inflation outpaced expectations in December, surging 0.3% month-over-month (exceeding the projected 0.2%) and pushing the annualized rate to 3.4% (up from the anticipated 3.2%). The core CPI mirrored this trend, increasing 0.3% monthly and 3.9% annually. Shelter costs remained the primary driver, rising 0.5% monthly and contributing a hefty 6.2% to the annualized figure. While easing slightly from its December 2022 peak of 6.4%, this persistent inflation underscores the ongoing pressure gripping the U.S. economy.
BTC & Altcoins Price Analysis
SEC approves BTC ETF
The Securities and Exchange Commission (SEC) has approved 11 spot bitcoin ETFs through an expedited process, as outlined in a document published on the SEC website. The approved spot bitcoin ETFs are proposed by Bitwise, Grayscale, Hashdex, BlackRock, Valkyrie, BZX, Invesco, VanEck, WisdomTree, Fidelity, and Franklin.
BTC prices showed limited movement following the approval, while ETH prices surged by over 10% in response to the news. Market participants anticipated the processing of an ETH ETF in the wake of this development.
ETF Launch
The inaugural trading day for 11 spot Bitcoin ETFs on the US stock markets was marked by significant activity, witnessing various price fluctuations that led to both a multi-year peak and a substantial decline.
During their inaugural trading session, total volume reached $4.6 billion. Prominent participants in this market included Grayscale ($2.3 billion), BlackRock ($1 billion), Fidelity ($700 million), ARK 21Shares ($288 million), and Bitwise ($125 million). This event recorded over 700,000 individual trades.
In addition, there are reports of investors shifting away from Bitcoin ETF proxies such as BITO and mining shares, reallocating capital into more lucrative proxies, similar to the newly introduced spot ETFs. This transition might have slightly dampened ETF inflows and could take several months to fully materialize.
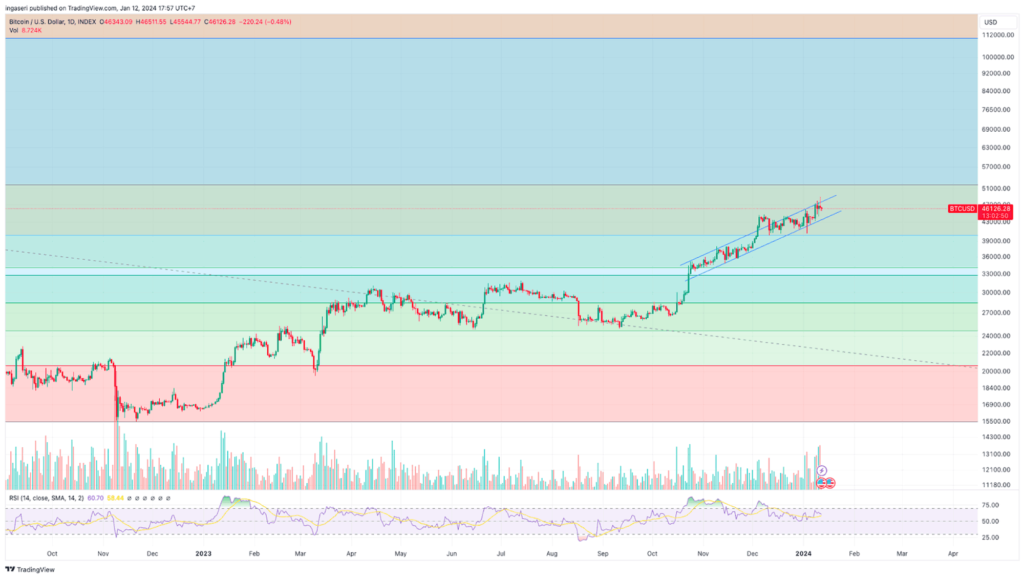
However, the price of BTC increased by approximately 5% throughout the week. The weekly Relative Strength Index (RSI) remains in the elevated range at 77. Support is observed at the 45,000 level.
Alts
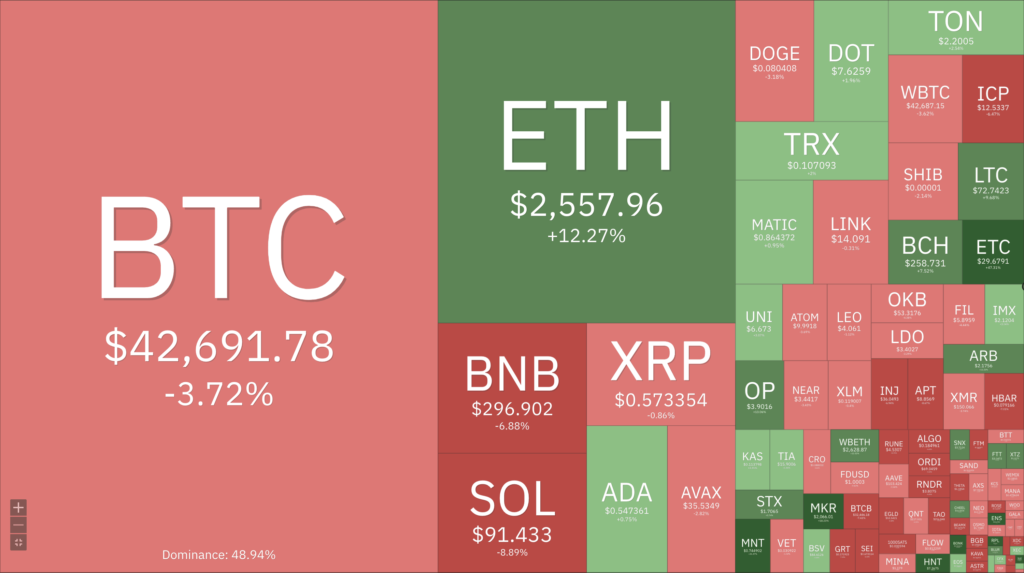
On a daily scale, most altcoins are currently showing slight losses, except for BCH and FTT, which have experienced double-digit surges. While most alternative coins mirrored BTC’s highly volatile performance in recent days, they have now stabilized with minor losses. ETH, BNB, SOL, XRP, ADA, AVAX, DOGE, and DOT are all showing slight declines on a daily scale.
Contrasting these movements, Bitcoin Cash and Litecoin have demonstrated resilience. BCH has surged by over 11%, reaching $285, while LTC hovers around $75 after a 5% increase. FTT stands out as the top performer among the top 100 altcoins, with FTX’s native token experiencing a 19% surge and trading well above $3.
The overall cryptocurrency market cap has experienced a decline of approximately $20 billion overnight, settling at $1.760 trillion. The entire crypto market has reached the lower boundary of the Fibonacci golden ratio line, a critical resistance level. Surpassing this line would indicate a substantial upward movement.

On-Chain Analysis
- 📊 Exchange: Net deposits on exchanges are low compared to the 7-day average. Lower deposits can be interpreted as lower selling pressure. As the exchange reserve continues to rise, it indicates higher selling pressure.
- 💻 Miners: Miners’ are selling more holdings compared to its one-year average. Miner’s revenue is in a moderate range, compared to its one-year average.
- 🔗 On-Chain: More investors are selling at a profit. In the middle of a bull market, it can indicate a market top. Long-term holders’ movement in the last 7 days was lower than the average. They have a motive to hold their coins. Investors are in a belief phase where they are currently in a state of high unrealized profits.
- 🏦 Derivatives: Long-position traders are dominant and are willing to pay short traders. Selling sentiment is dominant in the derivatives market. Takers fill more sell orders. As open interest decreases, it indicates investors are closing futures positions and the possibility of trend reversals. In turn, this might trigger the possibility of a long/short squeeze caused by sudden price movement or vice versa.
- 🔀 Technicals: RSI indicates a neutral condition. Stochastic indicates a neutral condition where the current price is in a moderate location between the highest-lowest range of the last 2 weeks.
News About Altcoins
- ETH Shines With 15% Weekly Gains After Spot Bitcoin ETF Announcement. Ether (ETH) enjoyed its best week since March 2023, rising 15% as investors shifted focus to a potential Ether ETF shortly. Analysts believe the sell-the-news effect contributed to Bitcoin’s decline, while ether benefited from expectations of its own ETF approval. Litecoin is also thriving, on track for an 11% weekly gain, while crypto stocks and miners are following Bitcoin’s downward trend.
News from the Crypto World in the Past Week
- BlackRock CEO Larry Fink envisions Bitcoin and Ether ETFs as mere stepping stones towards a bolder vision: “tokenization” of all assets. He believes the recent arrival of these ETFs is just the opening act of a financial revolution built on tokenized securities. From stocks and bonds to even traditional instruments like ETFs, Fink anticipates all will be swept into the wave, drawn by promises of lower fees and faster settlement times. His remarks follow a record-breaking first day for Bitcoin ETFs, with a staggering $4.6 billion in inflows. Analysts, further fueling the fire, predict an Ether ETF launch before Q2 ends, potentially accelerating the mainstream adoption of these tokenized assets.
Cryptocurrencies Market Price Over the Past Week
Cryptocurrencies With the Best Performance
- Ethereum Name Service +79,28%
- Sui (SUI) +42,62%
- Helium (HNT) +27,60%
- Bonk (BONK) +24,09%
Cryptocurrencies With the Worst Performance
- THORChain -12,64%
- Beam (BEAM) -9,63%
- Solana -7,59%
- Theta Network (THETA) -7,57%
References
- Tanaya Macheel, Bitcoin losses accelerate following ETF launch, ether posts a 15% gain on week, cnbc, accessed on 13 January 2024.
- Liam Kelly, BlackRock’s Larry Fink says Bitcoin and Ether ETFs are ‘stepping stones to tokenisation”, dlnews, accessed on 13 January 2024.
Share
Related Article


See Assets in This Article
SOL Price (24 Hours)
Market Capitalization
-
Global Volume (24 Hours)
-
Circulating Supply
-