Market Analysis Sept 5-11: BTC and ETH in Positive Trend, LUNA and LUNC Prices Surge
Ahead of this week which will be filled with various important macro data releases, crypto market managed to stay in the green zone in the last week. Bitcoin had dropped to 18.535 US dollar, but managed to reverse the trend and back to 21.800 US dollar at the weekend.
Meanwhile ETH price still going uptrend carried by positive catalyst ahead ‘the merge’. However, LUNA and LUNC managed to stole the spotlight because they price climbed more than 200% in the last week.
Pintu’s team trader has collected various important data about the price movement of the crypto asset market over the past week which summarized by this Market Analysis. However, you should note that all this information is intended for information and educational purposes, not financial advice.
Market Analysis Summary
- ⚠️ This week, the market will focus on the release of US inflation data for August.
- 💹 The total crypto market cap has finally rallied back to the 1 trillion mark once again after BTC leading the rest of the pack with 8% rise WoW.
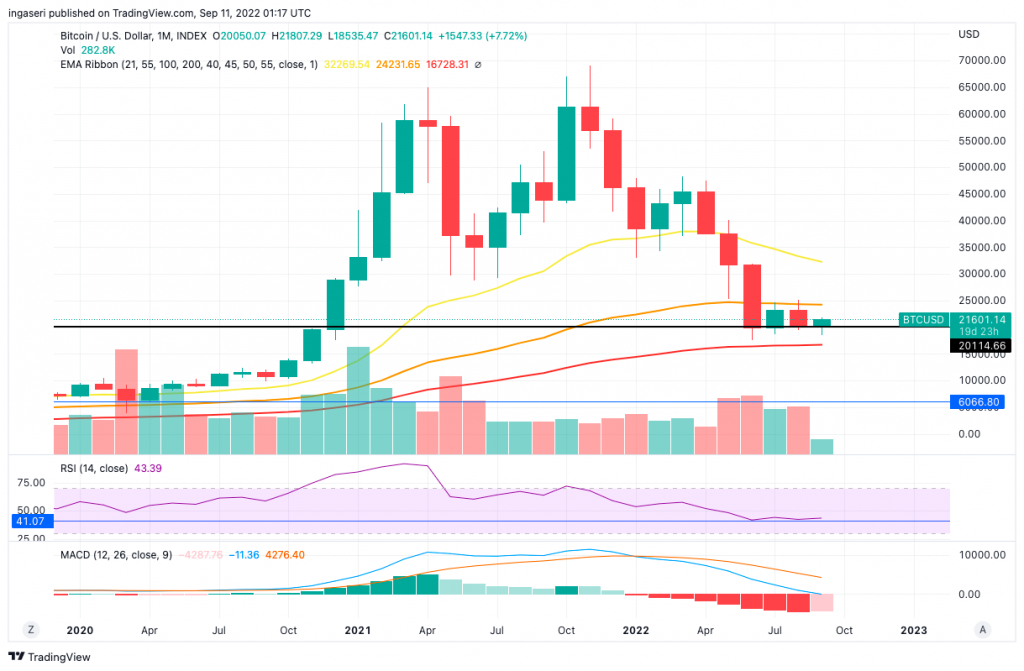
- 💲 BTC managed to maintain US$ 20.000 as monthly support level for the past four month in a row.
- 💰 Ahead of ‘the merge’, ETH still gaining positive momentum even though it indicated still moving in a downtrend on a macro basis, until it proven otherwise.
Macroeconomy Analysis
This Week is An Important Week
We are starting the week with a full packed week of actions. On the 12th of September, the survey for consumer expectations for the month of August will be released. Consumer expectations refer to the economic outlook of households. Expectations will have a significant bearing on current economic activity. If people expect an improvement in the economic outlook, they will be more willing to borrow and buy goods.
Previous number was 6.2%. It is, however, expected to show some moderation as gasoline prices plunged while food inflation remained on the rise. Inflationary pressure continues to ease and supply chain disruptions continue to be less intense. Economic growth however remains weak, albeit not recessionary. 16th of September’s preliminary reading of consumer sentiment should continue to rebound since it too is very much affected by gasoline prices.
The highest impact upcoming event would be that of the YoY inflation rate and CPI data released on the 13th of September and the PPI MoM on the following day. The previous inflation rate YoY was at 8.5%, Core inflation rate YoY was at 5.9%, while consensus is at 8.1% and 6.1%, respectively.
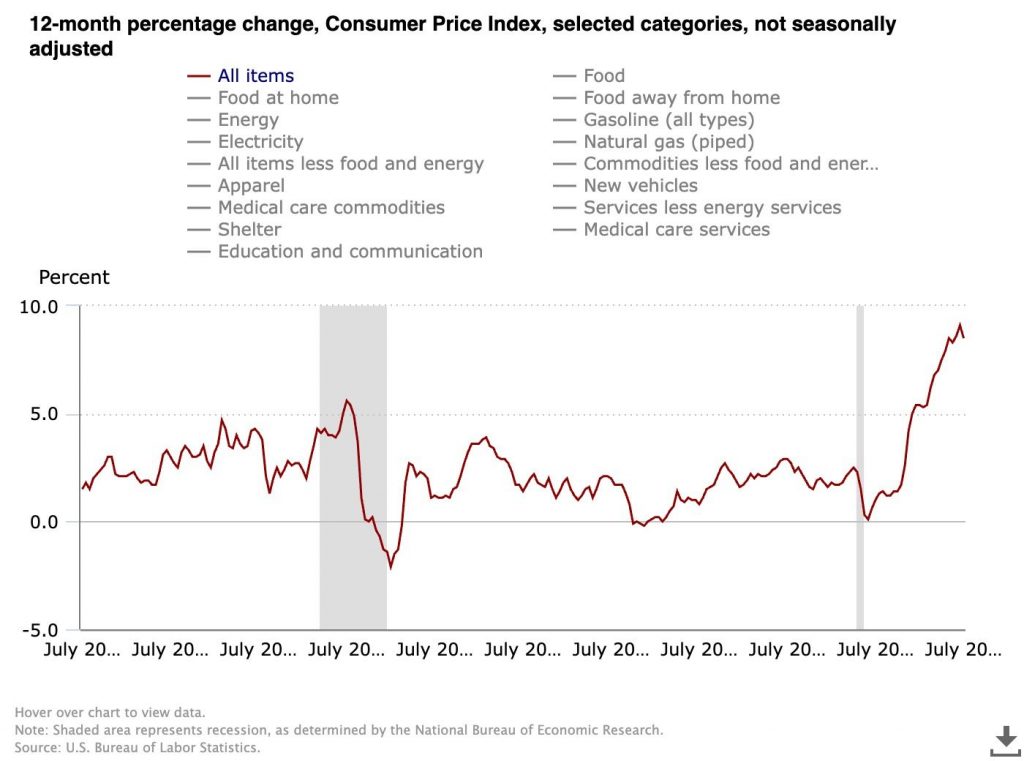
Non-US Narrative Becomes Last Week Market Movers
This week, non-US markets drove most of the narrative. As mentioned in the previous market analysis, the ECB raised interest rates by 75 bps in an effort to get their policy position to a more appropriate stance. The overnight bank funding rate is positive for the first time in 10 years.
The core problem Eurozone is having right now is the soaring energy costs: with the Nord Stream pipeline shut down, Europe will have to deal with energy rationing over the winter. Expect the growth in the Eurozone to be stagnant throughout the year.
Meanwhile, the Japanese Yen has weakened to its lowest level since 1998. The BOJ and BOC are the two major central banks that are not raising rates to fight inflation and currencies are getting hurt for it.
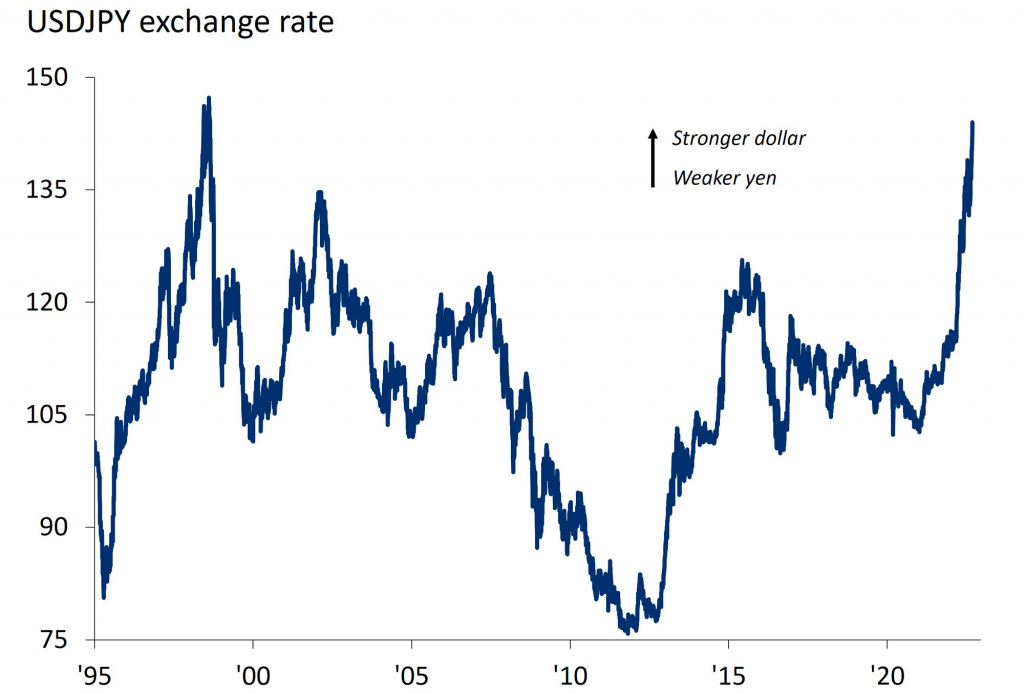
Due to demand concerns, crude oil prices are at their lowest level since the start of the year. This should help the CPI data. A strong dollar helps rising inflation from imports and reduces the whole global manufacturing activities. Shipping costs are already down almost 65% from their highs during the major covid season last year.
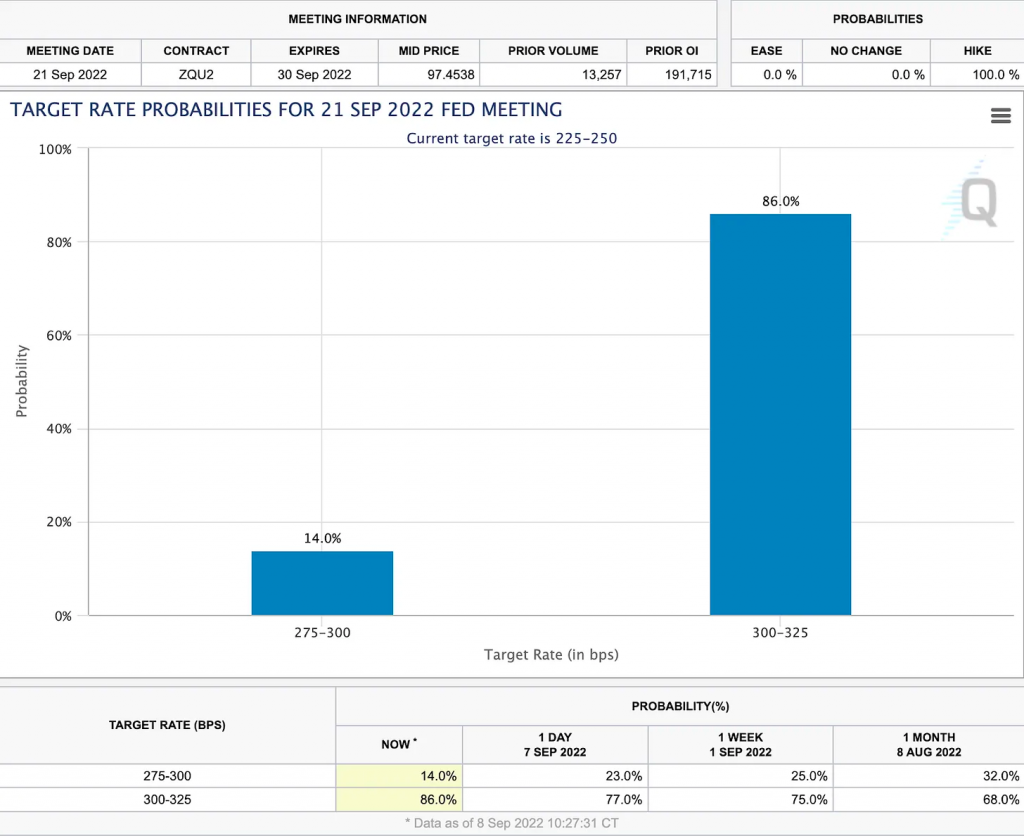
Fed is predicted to raise the interest rates by a further 75 bps at their meeting in two weeks (21st September). They are still not convinced that they have done enough to make sure inflation peaked, though recent data and indicators suggest that they are well on their way. This September raise could very well be the last raise Fed will implement in this cycle. This will mark a critical turning point for the global market.
Bitcoin Price Movement 5-10 September 2022
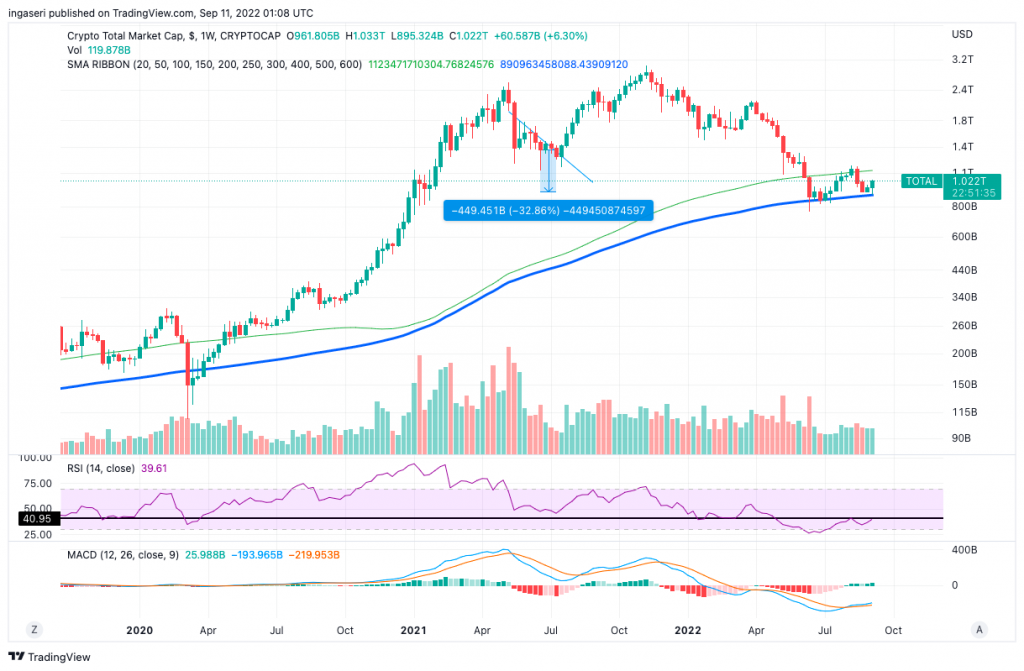
The total crypto market cap has finally rallied back to the 1 trillion mark once again after BTC leading the rest of the pack with 8% rise WoW.
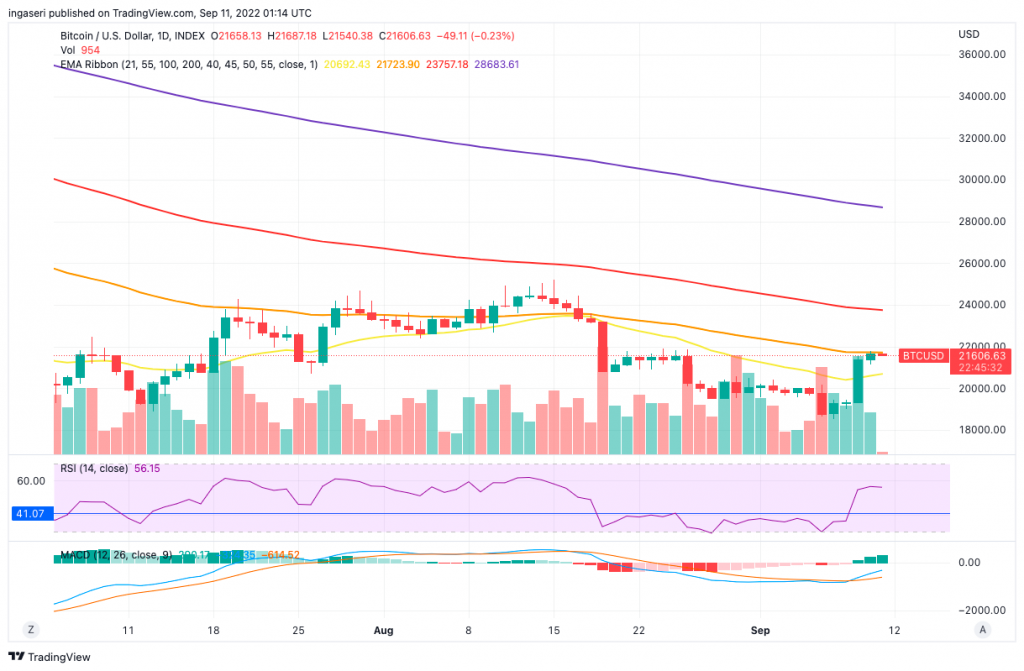
BTC had a tumultuous week, with prices dropping to the $18,535 in the beginning of the week, before soaring to ~21,800 towards the end of the week. This price action has been somewhat exciting, even if it’s not trend defining. Currently BTC has a resistance at the 55 day EMA line, ~22k price range. Next resistance is the 200 days MA, at 23,200 price range, which is historically important support for the price action.
This is the fourth consecutive month that BTC has been successfully holding the 20k monthly level as support.
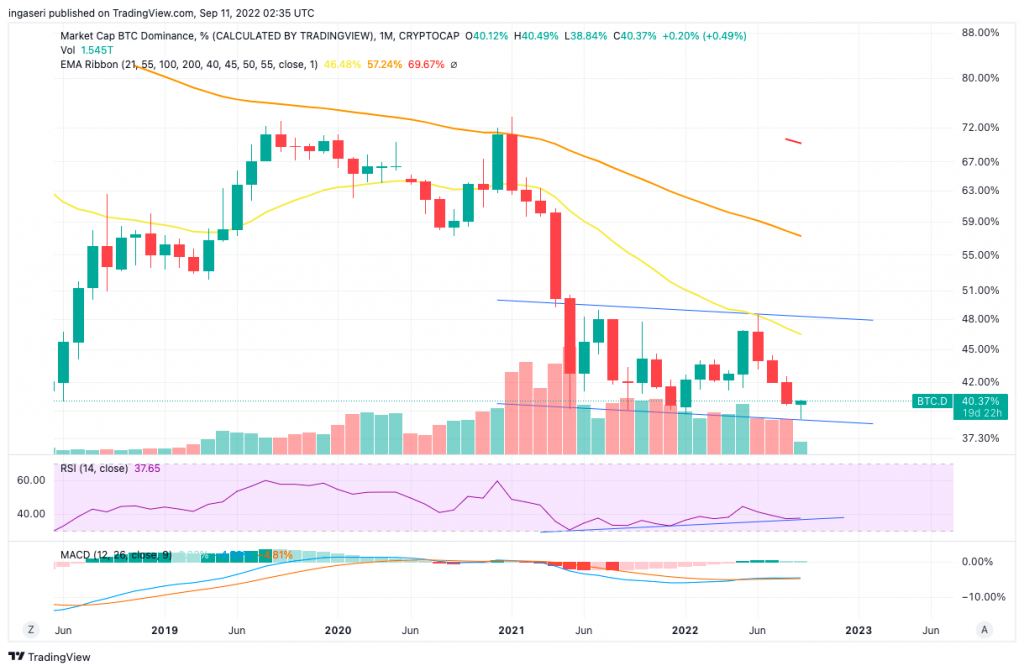
Bitcoin dominance has recently touched the bottom of the downtrending wedge structure. Its RSI is also in confluence as it touches the support of the ascending trend line.
Ethereum Price Movement 5-10 September 2022
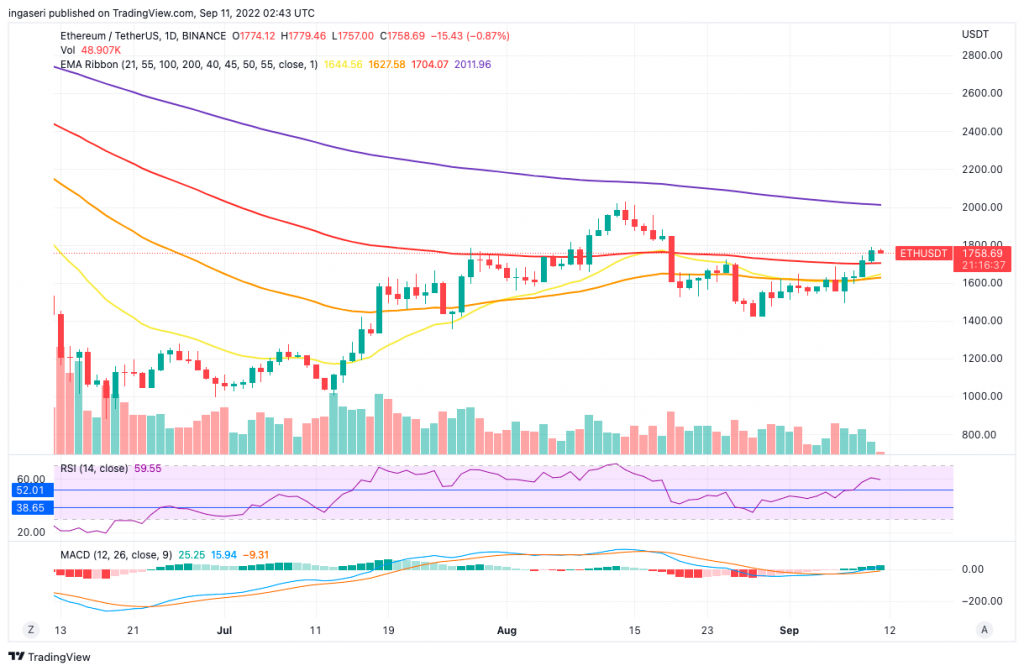
ETH has continue its positive momentum since the beginning of the month, gaining 13.5% MoM. It is still riding on the upcoming merge news. The price action might be more volatile as we approach the merge. It could be buy the rumor, sell the news type of event.
ETH in itself is still in a macro downtrend until proven otherwise, the move has all the relief rally characteristics.
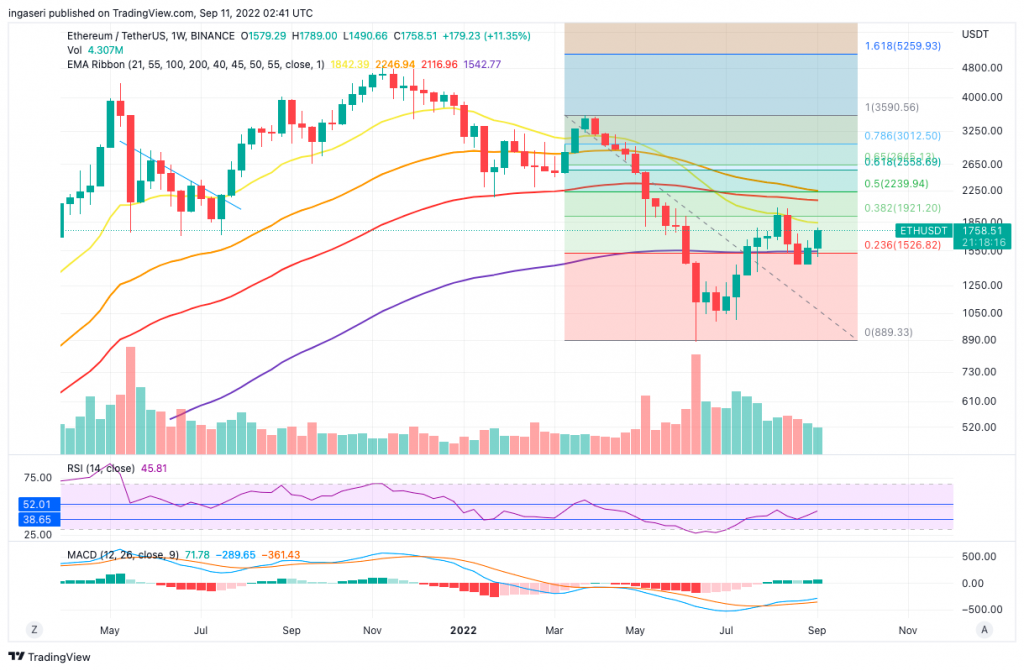
On the weekly chart, we can see a positive momentum as ETH breaks out of the 200 weeks EMA. The next resistances will be at 1850 and 1920.
LUNA and LUNC Price Surge
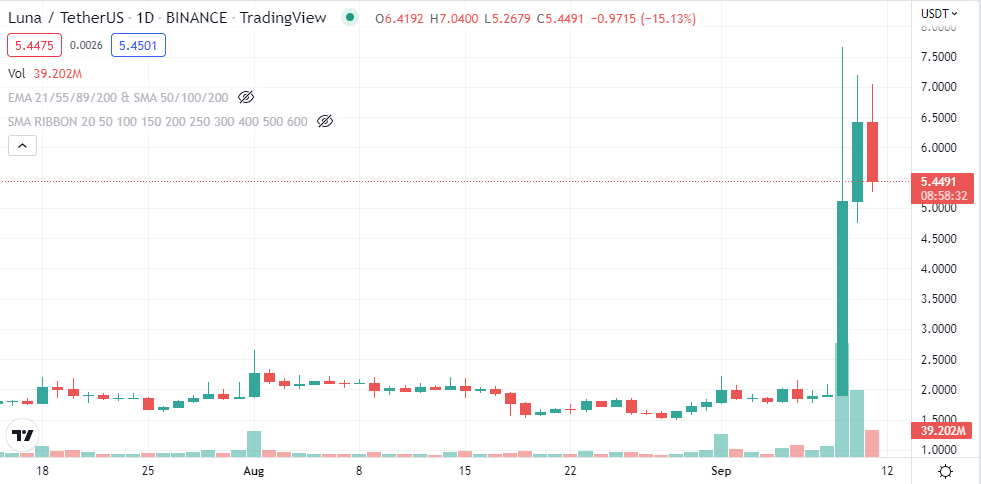
LUNA and LUNA Classic (LUNC), two Terra tokens, have shockingly skyrocketed in price by hundreds of percent since last week.
The price of LUNA, a native token from the second iteration of the Terra blockchain, climbed from 2 US dollars to 7 US dollars last week, a gain of more than 200%.
The same thing happened on LUNC, a token from Terra Classic blockchain, increased more than 250% to 0,0005 US dollars.
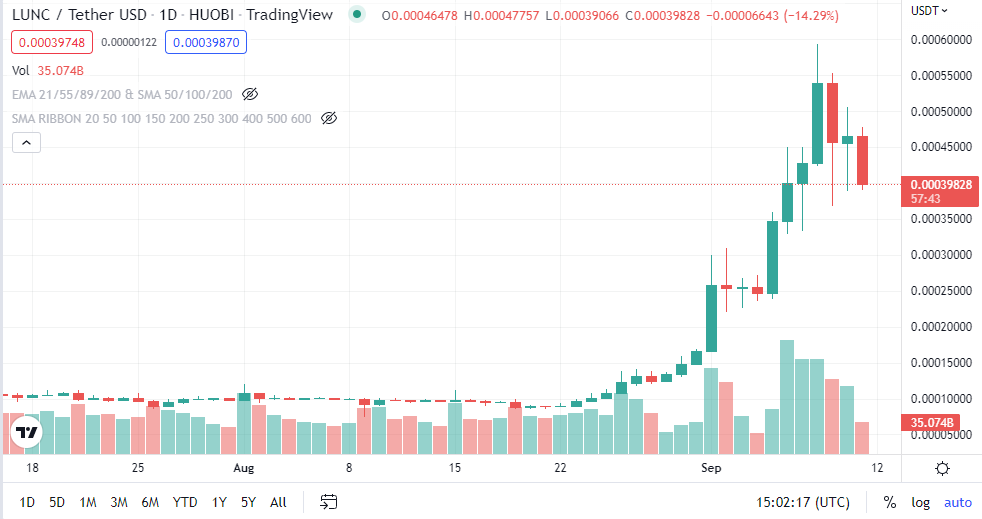
The increase in LUNC was possibly caused by the LUNC staking service that went live on 27 August. As reported by Cointelegraph, the staking service reduced almost 9% of LUNC supply from circulation. In addition to staking services, LUNC has also recently passed a governance proposal that will impose a token burn tax of 1.2% on all its transactions, which in return will make LUNC deflationary.
DXY Index
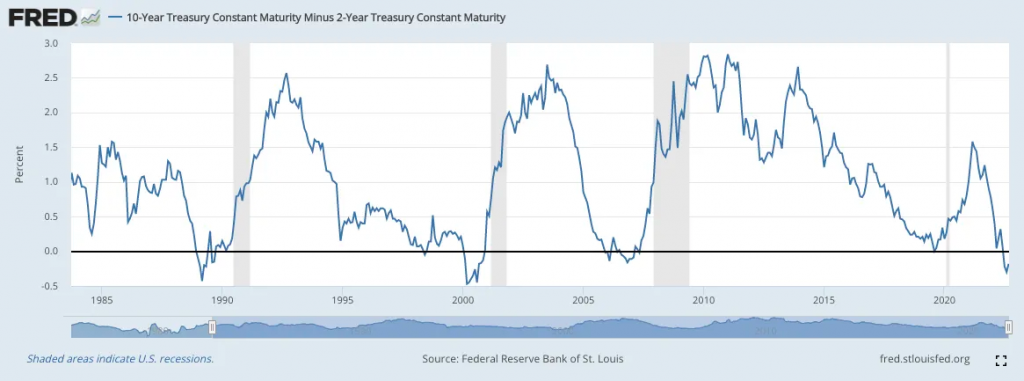
The 2-10Y spread currently sits at about -0.2, which is its lowest value yet since 22 years ago. When it’s negative, market is very pessimistic about the near-term economic environment.
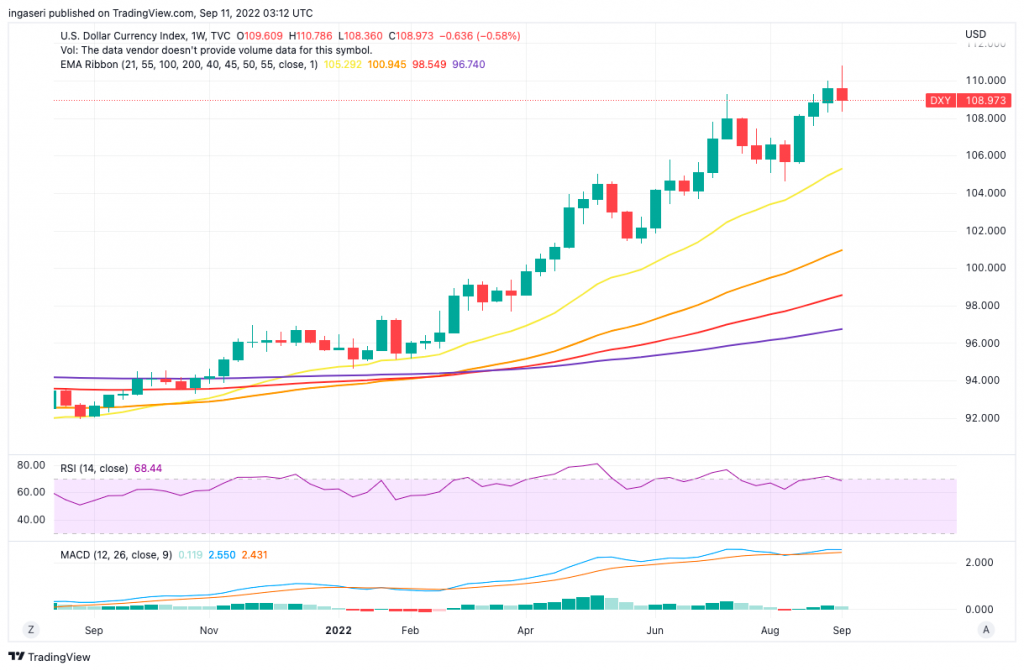
The DXY has also retraced after we saw the index break above $110 for the first time since June 2022. The rise in USD value has exacerbated the decent declines we’ve seen in oil and gold prices. With the DXY in the red, it could help the equities and crypto market.
On-Chain Analysis
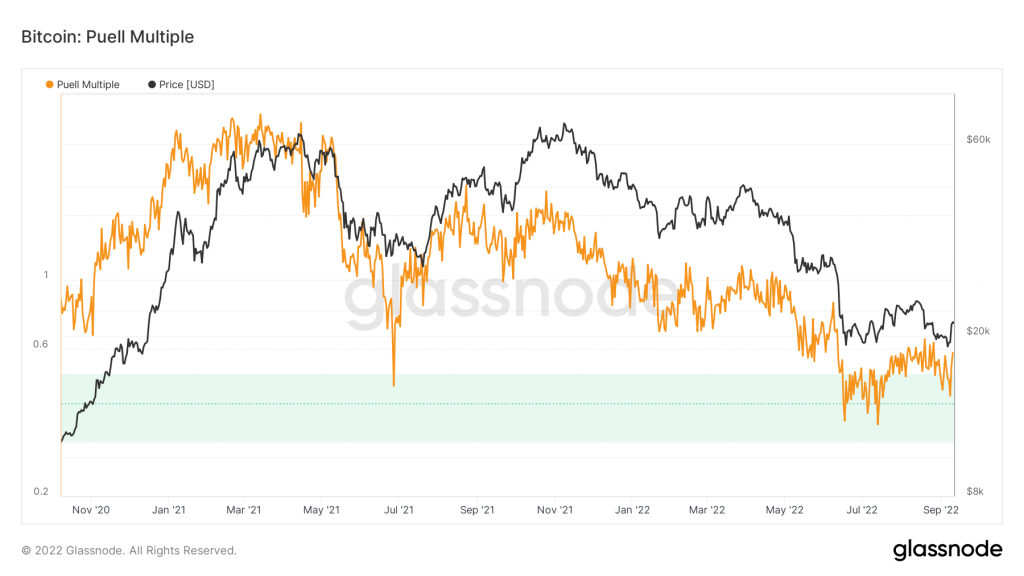
Taking a look at the Puell Multiple charts, we are once again out of the green zone, which historically represents a good buying opportunity. This multiple is calculated by dividing the daily issuance value of bitcoins (in USD) by the 365-day moving average of the daily issuance value.
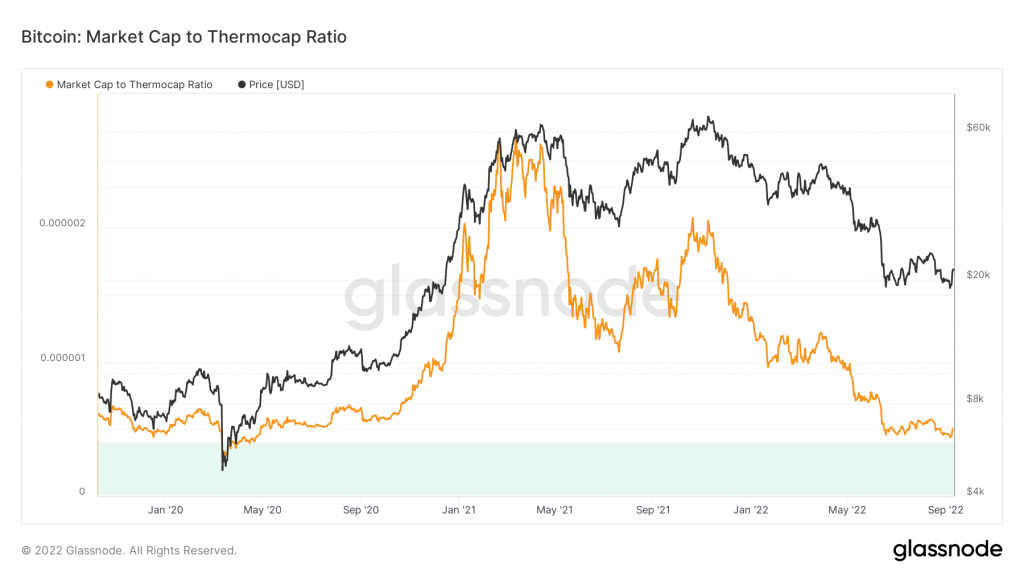
In the Market Cap to Thermocap Ratio chart, we can see that we are still not in the green (value) zone. This measure is further evidence of the relative mild intensity of this cycle’s bull run. The Market Cap to Thermocap Ratio is simply defined as Market cap divided by Thermocap, and can be used to assess if the asset’s price is currently trading at a premium with respect to total security spent by miners. The ratio is adjusted to account for the increasing circulating supply over time.
- 📊 Exchange: As the exchange reserve continues to rise, it indicates higher selling pressure. Net deposits on exchanges are low compared to the 7-day average. Lower deposits can be interpreted as lower selling pressure.
- 💻 Miners: Miners’ are selling holdings in a moderate range compared to its one-year average. Miner’s revenue is in a moderate range, compared to its one-year average.
- 🔗 On-Chain: More investors are selling at a profit. In the middle of a bull market, it can indicate a market top. Long term holders’ movement in the last 7days were lower than the average. They have a motive to hold their coins. Investors are in a capitulation phase where they are currently facing unrealized losses. It indicates the decreasing motive to realize loss which leads to a decrease in sell pressure.
- 🏦 Derivatives: Long position traders are dominant and are willing to pay to short traders. Selling sentiment is dominant in the derivatives market. More sell orders are filled by takers. 7 day OI increased by 9%. As open interest increases, it indicates more liquidity, volatility, and attention are coming into the derivative market. The increasing trend in OI could support the current ongoing price trend.
Altcoin News
- 🔎 Algorand (ALGO) added trustless cross-chain crypto communication. Algorand has undergone an upgrade which places its layer 1 protocol as one of the fastest in crypto. After the upgrade, the transaction capacity has shot up to 6.000 transactions per second (tps).
More News from Crypto World in the Last Week
- 🚨 74% ethereum nodes merge ready ahead of Bellatrix upgrade. The Bellatrix upgrade is necessary steps prior to the official Merge, which will see Ethereum transition to a proof of stake (PoS) consensus. Ahead of upcoming Bellatrix upgrade, as many as 73,5% ethereym nodes are now marked as “merge ready” according data from Ethernodes.
- 💲Binance converting several stablecoins to BUSD. Binance announced on 6th Sept that it would begin auto-converting existing and new deposits of USDC, USDP, and TUSD stablecoins into its native BUSD. Binance says the move will enhance liquidity and capital efficiency for users and the change is set to take effect on September 29.
- 🎵 Sony Music files trademark application for NFT-authenticated music. Recently Sony Music Entertainment has signaled intentions to utilize non-fungible tokens (NFTs) after filing a trademark application covering audio and video recordings featuring live musical performances authenticated by NFTs.
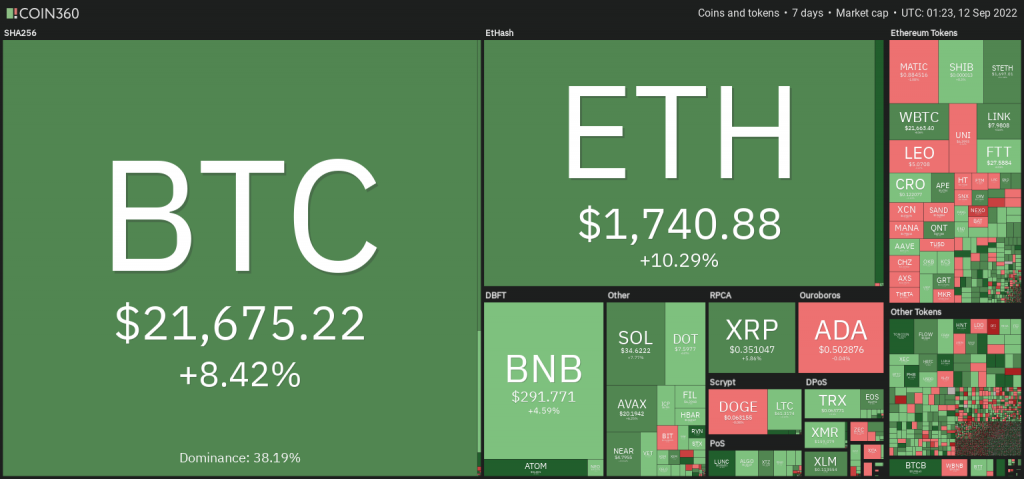
Cryptocurrencies Market Price Over the Past Week
Cryptocurrencies With the Best Performance
- Curve Finance +17,34%
- The Graph +15,67%
- Chainlink +15,21%
- Compound +13,29%
Cryptocurrencies With the Worst Performance
- Chiliz (CHZ) 6,82%
- 1inch Network 4,17%
- Axie Infinity (AXS) 0,95%
Reference
- Stephen Katte, Sony Music Files Trademark Application for NFT-Authenticated Music, Cointelegraph, accessed on 11 September 2022.
- Jason Nelson, Binance Pulling Support of USDC, Converting Several Stablecoins to BUSD, Decrypt, accessed on 11 September 2022.
- Brayden Lindrea, 74% of Ethereum Nodes ‘Merge Ready’ Ahead of Bellatrix Upgrade, Coin Telegraph, accessed on 11 September 2022.
- Anushamal, Algorand Added Trustless Cross-Chain Crypto Communication And Other Enhancements After A New Upgrade, Bitcoinist, accessed on 11 September 2022.
- Yashu Gola, Here’s why Terra Classic price has soared by 250% in September, Cointelegraph, accessed on 12 September 2022
Share
Table of contents
Related Article
See Assets in This Article
COMP Price (24 Hours)
Market Capitalization
-
Global Volume (24 Hours)
-
Circulating Supply
-
