Ethereum Price Slips to $3,800 – Here’s Why ETH Is Struggling to Break Above $4,000
Jakarta, Pintu News – Throughout October, the price of Ethereum (ETH) has continued to struggle to build strength above the $4,000 level. While still generally on an uptrend, ETH is currently trading at around $3,800, down 6.3% in the past week – showing hesitation as Bitcoin (BTC) begins to recover.
Signals from on-chain data and technical analysis illustrate a clear situation: the Ethereum rally is still waiting for strong confirmation.
Here are the three main reasons why ETH hasn’t been able to convincingly break $4,000 anytime soon – and why the real test could be at slightly higher levels. Before that, let’s take a look at Ethereum’s price movement today.
Ethereum Price Drops 1.42% in 24 Hours
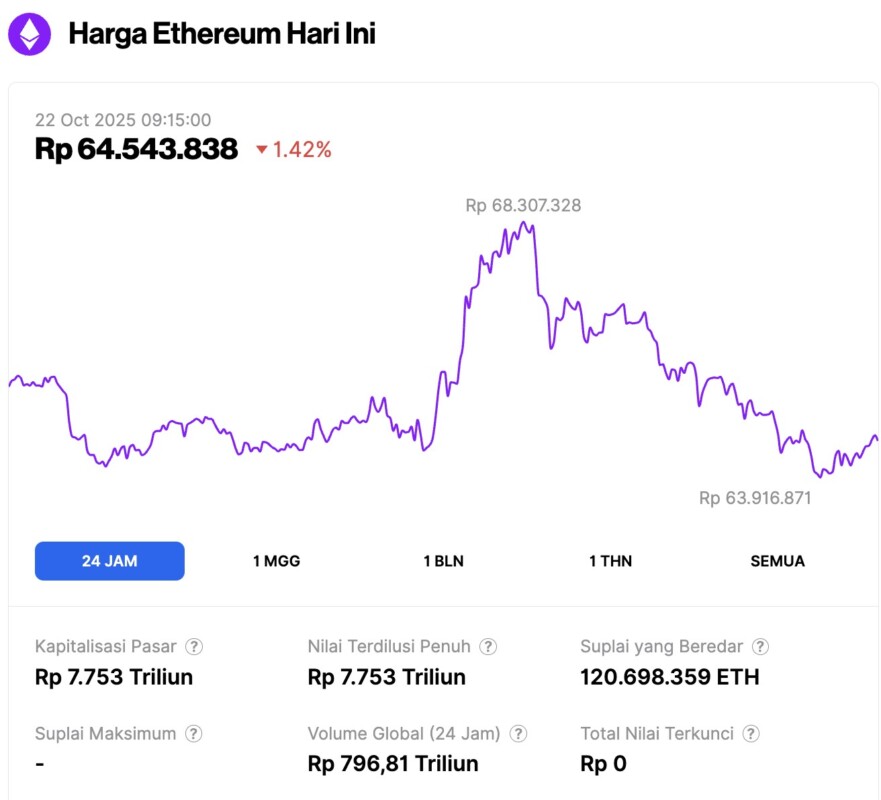
On October 22, 2025, Ethereum was trading at approximately $3,873, or around IDR 64,543,838, after slipping by 1.42% over the past 24 hours. During this time, ETH hit a low of IDR 63,916,871 and reached a high of IDR 68,307,328.
At the time of writing, Ethereum’s market capitalization stands at roughly IDR 7,753 trillion, while its daily trading volume has surged by 36% in the last 24 hours to reach IDR 796.81 trillion.
Read also: Bitcoin Drops to $108,000 Today — Is the Decline Set to Continue?
Whales Start Selling, Accumulation Slows
The first sign of pressure came from the largest Ethereum holders – the whales. Since October 20, whale addresses have reduced their holdings from 100.60 million ETH to 100.46 million ETH.
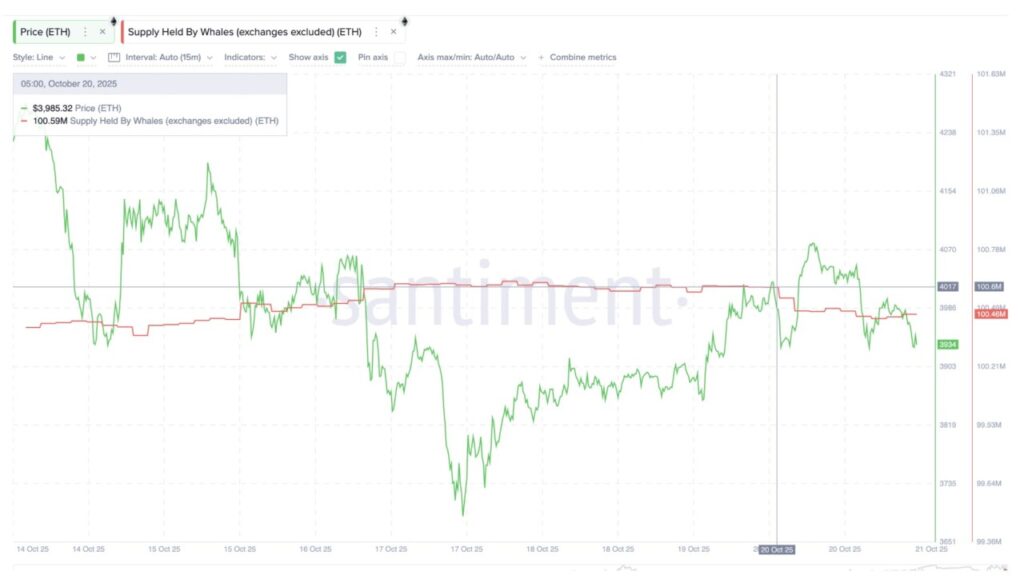
This drop of around 140,000 ETH – worth approximately $550 million at current prices – created selling pressure that was unnoticeable but still held back a potential short-term rally, and kept the market cautious.
At the same time, Ethereum’s Holder Accumulation Ratio (HAR) indicator – which measures the percentage of active holders adding to positions versus subtracting – also stagnated at around 30.77%. Previously, this figure had risen at the beginning of October, but it has been flat since the middle of the month, signaling that new accumulation has started to slow down.
Simply put, existing holders are not aggressively buying anymore, and new funds have not come in much.
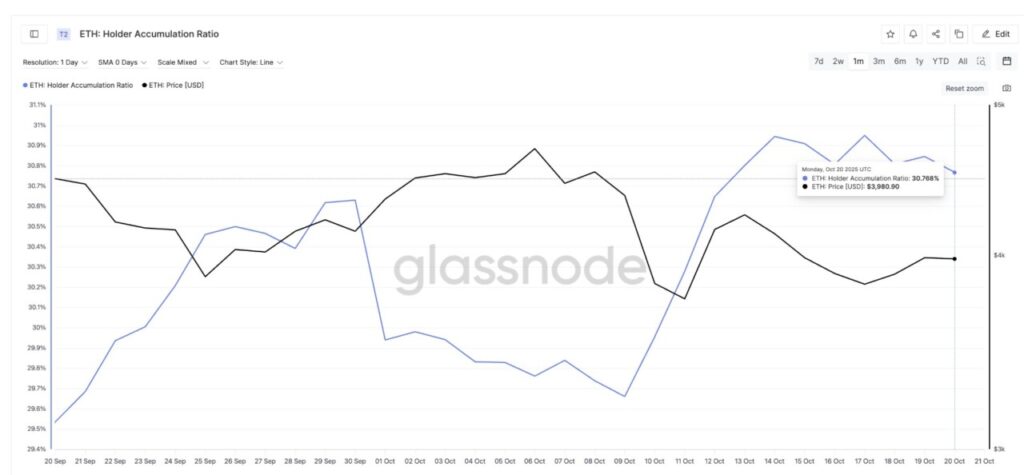
When HAR starts moving flat after a previous uptrend, it’s often a signal that traders are waiting for a clear breakout before getting back in. It is this cautious attitude from whales and active holders that explains Ethereum’s recent hesitation to break $4,000.
Solid Resistance Zone Above $3,955 Resists Price Rise
The second reason why Ethereum is still on hold is the Cost Basis Distribution (CBD) map – a tool that shows where most of the last ETH supply changed hands. This map helps identify “supply walls” or price zones where many holders are likely to sell to recoup previous losses.
Currently, there is a solid resistance zone between $3,955 to $4,015, where approximately 1.06 million ETH were purchased in this range. This means that every time the price of ETH approaches $4,000, selling pressure increases as many previous holders want to exit at breakeven or with little profit.
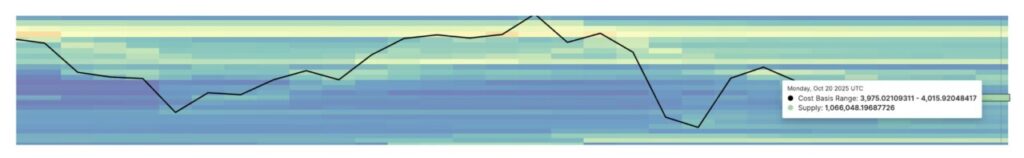
However, the challenges did not stop there. There was another large cluster between $4,270 and $4,314, where almost 1.33 million ETH was bought. This zone is adjacent to the technical resistance at $4,340 (which will be further discussed later), and will most likely be a true breakout test for Ethereum.
Read also: VanEck Officially Filed the First Lido Staked ETH-Based ETF in the US!
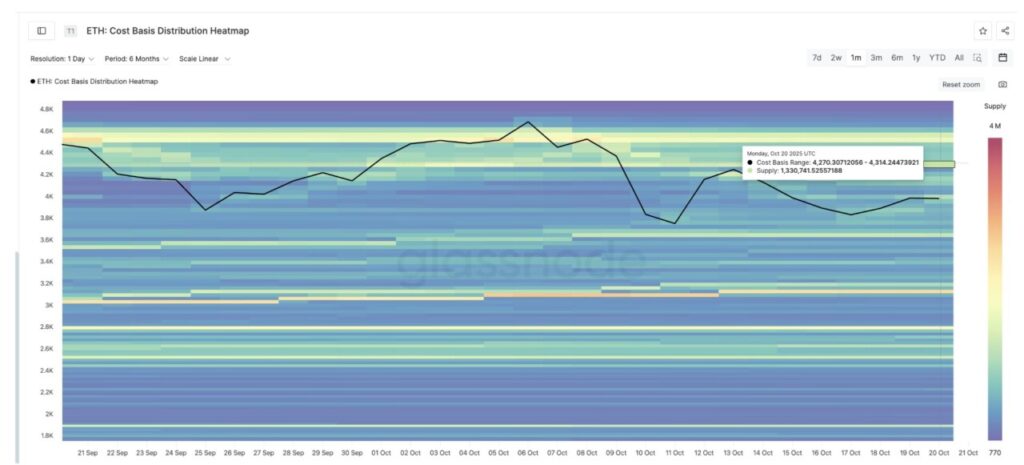
As long as ETH hasn’t been able to break through these two layers of resistance, traders are likely to continue taking profits near $4,000, hindering its continued upside potential.
Ethereum price structure still bullish, but needs a close above $4,340
Despite facing a number of obstacles, Ethereum’s technical structure is still showing strength. ETH price is still holding above the uptrend line that has been forming since early August, keeping the medium-term trend direction positive.
On the daily chart (10/21), ETH is seen reacting to the Fibonacci retracement level of the previous rally:
- 0.618 level is around $4,200
- 0.786 level is near $4.340
These two levels coincide with key resistance zones based on on-chain data (from the CBD map). If the daily price manages to close above $4,340, it will confirm the breakout and open the way to $4,520, even $4,960, which is an area close to the all-time high.
However, the first hurdle to cross remains $4,000, which is also the 0.382 Fibonacci level – and has been the level it has been trying to break since October 16.
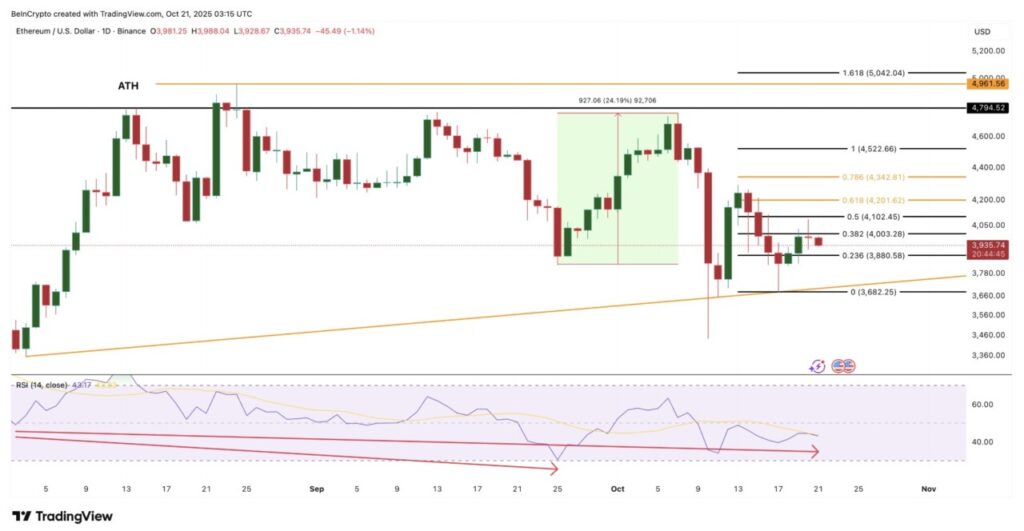
Furthermore, the Relative Strength Index (RSI) indicator – which measures buying and selling strength – shows a hidden bullish divergence. That is, the price is forming higher lows, while the RSI has recorded lower lows since August 2. This pattern often signals that the uptrend is still ongoing despite short-term weakness.
The last time this pattern appeared (between August 2 and September 25), Ethereum gained almost 24%, approaching $4,880. If a similar pattern occurs again, ETH could be pushed towards the $4,960 zone. But this scenario will only be open if the breakout above $4,340 is actually confirmed.
Conversely, if ETH fails to hold above $3,880, the short-term sentiment could turn negative. In that scenario, the next support would be around $3,680, which is the base of its long-term trend line.
That’s the latest information about crypto. Follow us on Google News to get the latest crypto news about crypto projects and blockchain technology. Also, learn crypto from scratch with complete discussion through Pintu Academy and stay up-to-date with the latest crypto market such as bitcoin price today, xrp coin price today, dogecoin and other crypto asset prices through Pintu Market.
Enjoy an easy and secure crypto trading experience by downloading Pintu crypto app via Google Play Store or App Store now. Also, get a web trading experience with various advanced trading tools such as pro charting, various types of order types, and portfolio tracker only at Pintu Pro.
*Disclaimer
This content aims to enrich readers’ information. Pintu collects this information from various relevant sources and is not influenced by outside parties. Note that an asset’s past performance does not determine its projected future performance. Crypto trading activities have high risk and volatility, always do your own research and use cold cash before investing. All activities of buying and selling bitcoin and other crypto asset investments are the responsibility of the reader.
Reference:
- BeInCrypto. 3 Reasons Ethereum Price Stalls Below $4,000 – And Why The Real Test Lies Higher. Accessed on October 22, 2025
Latest News
© 2026 PT Pintu Kemana Saja. All Rights Reserved.
The trading of crypto assets is carried out by PT Pintu Kemana Saja, a licensed and regulated Digital Financial Asset Trader supervised by the Financial Services Authority (OJK), and a member of PT Central Finansial X (CFX) and PT Kliring Komoditi Indonesia (KKI). Crypto asset trading is a high-risk activity. PT Pintu Kemana Saja do not provide any investment and/or crypto asset product recommendations. Users are responsible for thoroughly understanding all aspects related to crypto asset trading (including associated risks) and the use of the application. All decisions related to crypto asset and/or crypto asset futures contract trading are made independently by the user.